Introduction to Cup handle
A cup and handle price pattern on a security’s price chart is a technical indicator that resembles a cup with a handle, where the cup is in the shape of a “u” and the handle has a slight downward drift. The cup and handle is considered a bullish signal, with the right-hand side of the pattern typically experiencing lower trading volume. However, there are exceptions to the shape of the cup and handle as well. Depending on the market situation, the cup can take the form of a “V” shape and the handle, usually a downward channel, can also take the form of a triangle at times. The cup handle is a trend continuation pattern that serves as a period of consolidation before the trend continues in its original direction. Since the cup handle consists of two primary patterns, mainly the cup and the channel, or triangle, it provides two potential entries for traders to trade. However, in this article, we will be only looking at one entry point, the entry right after price breaks out of the handle.
Cup and handle a complete guide – Quick Setup Tutorial
Content
Different types of cups and handles
As written in the introduction, the cup and handle patterns can vary in shapes. As for the cup, it commonly takes the shape of a “U”, but it may at times take the shape of a “V” as well. The difference between these two shapes is that the more rounded “U” shape cup indicates a consolidation period, whereas the sharper “V” shape cup indicates a sharper reversal towards the trend continuation. A rounded cup often also takes a longer time to form as compared to its “V” shaped relative. The handles of the cup handle pattern too, varies from triangles to price channels of different gradients. However, the differences are far more significant. The triangle shaped handle has a low occurrence rate in the market, however it only shows a period of consolidation in the same way as how the price channels would. The difference between the gradients of the price channels however, provides more insightful information to traders regarding the market. As a general rule of thumb, the handle size should never be greater than one third of the depth of the cup. When the gradient of the price channel is gentle, it shows a healthy sign that the break out would be more bullish as compared to the price channel of a steeper gradient.
Also read: Weighted exponential moving average
How to use
The cup handle pattern trading strategy allows two entries for traders to utilise. The first entry is when prices break out of the price channel, while the second is when prices break above the resistance of the rim of the cup.
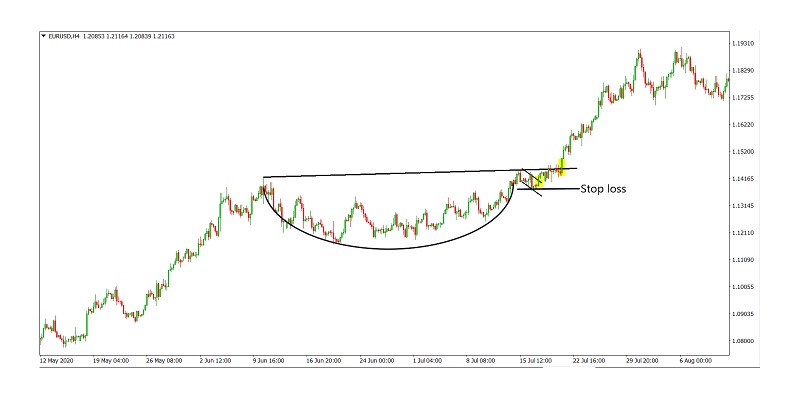
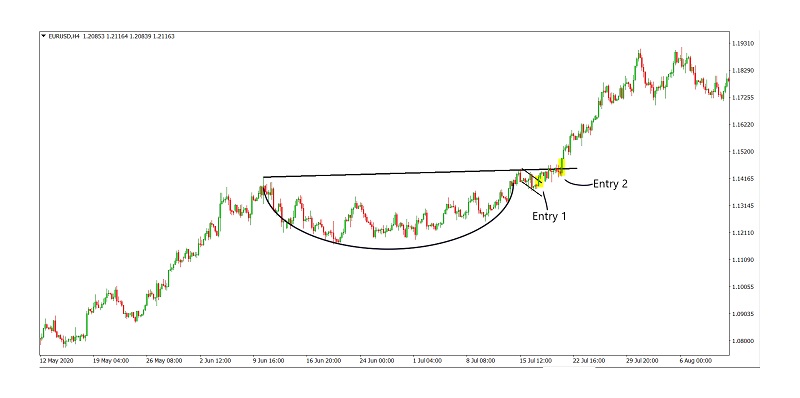 Although this strategy provides two entry points, the stop loss level and the take profit level are generally fixed. The stop loss level can be determined by half of the vertical width of the handle channel.
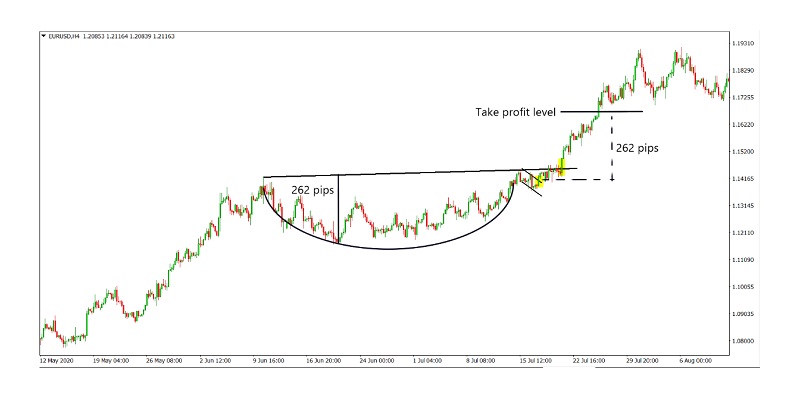
 As for the profit taking level, it can be determined by the amount of pips from the resistance line at the rim of the cup to the base of the cup, in other words the depth. The amount of pips is then traced and tracked from the top trend line of the handle from the point of the break out candle.
Pros and cons
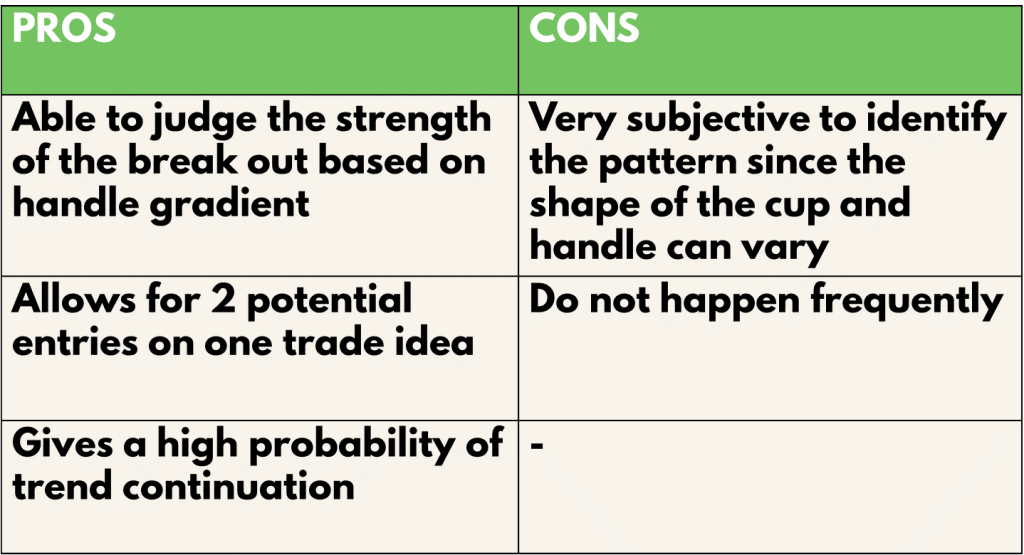
The Cup handle pattern strategy allows the trader to be trading with the trend since it is a trend continuation pattern which renders a higher win rate. On top of that, the strategy gives 2 potential entry points for the trader, essentially providing a back up plan in case he mises the first, or maybe allowing a more aggressive trading plan that consists of both of the entries. To top that off, the gradient of the handle of the cup handle pattern also provides valuable information on the strength of the break out. This allows to utilise the information and aids in the planning of the trades that he is going to take. However, this pattern strategy definitely does not occur often, more especially in the higher time frames which have a higher probability of winning. In addition, the cup handle pattern is very subjective to identification since the cups and handles can vary in shape. This uncertainty and lack of confirmation will be the greatest weakness of all chart patterns including this one.
Also read: Triangle pattern forex
Analysis
To find out the profitability of the cup handle pattern strategy, we decided to do a back test based on the past 5 trades from 14 May 21 on the H4 timeframe. The rules for entry will be the same as what was mentioned above. We will be back testing this throughout 3 types of trading vehicles, namely, EURUSD for forex, AAPL for stocks and BTCUSD for cryptocurrency. For simplicity, we will assume that all trades taken have a risk of 1% of the account.
Definitions: Avg Risk reward ratio= ( Total risk reward ratio of winning trades/ total no. of wins)
Profitability (% gain)= (no. of wins* reward)- (no of losses* 1) [ Risk is 1%]
An example of the application of the strategy:
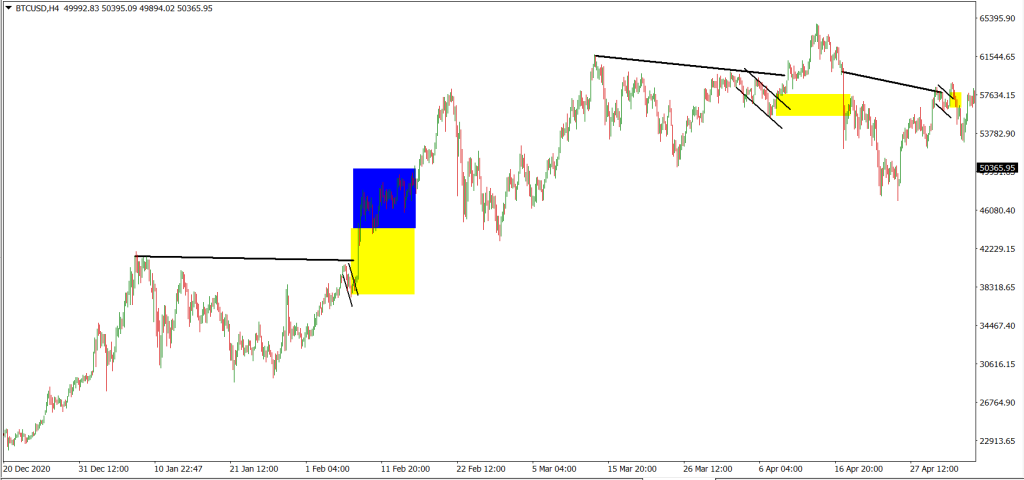
For the Backtest results, trades with blue and yellow zones indicate an overall win with the blue zone as reward and the yellow zone as the risk taken.
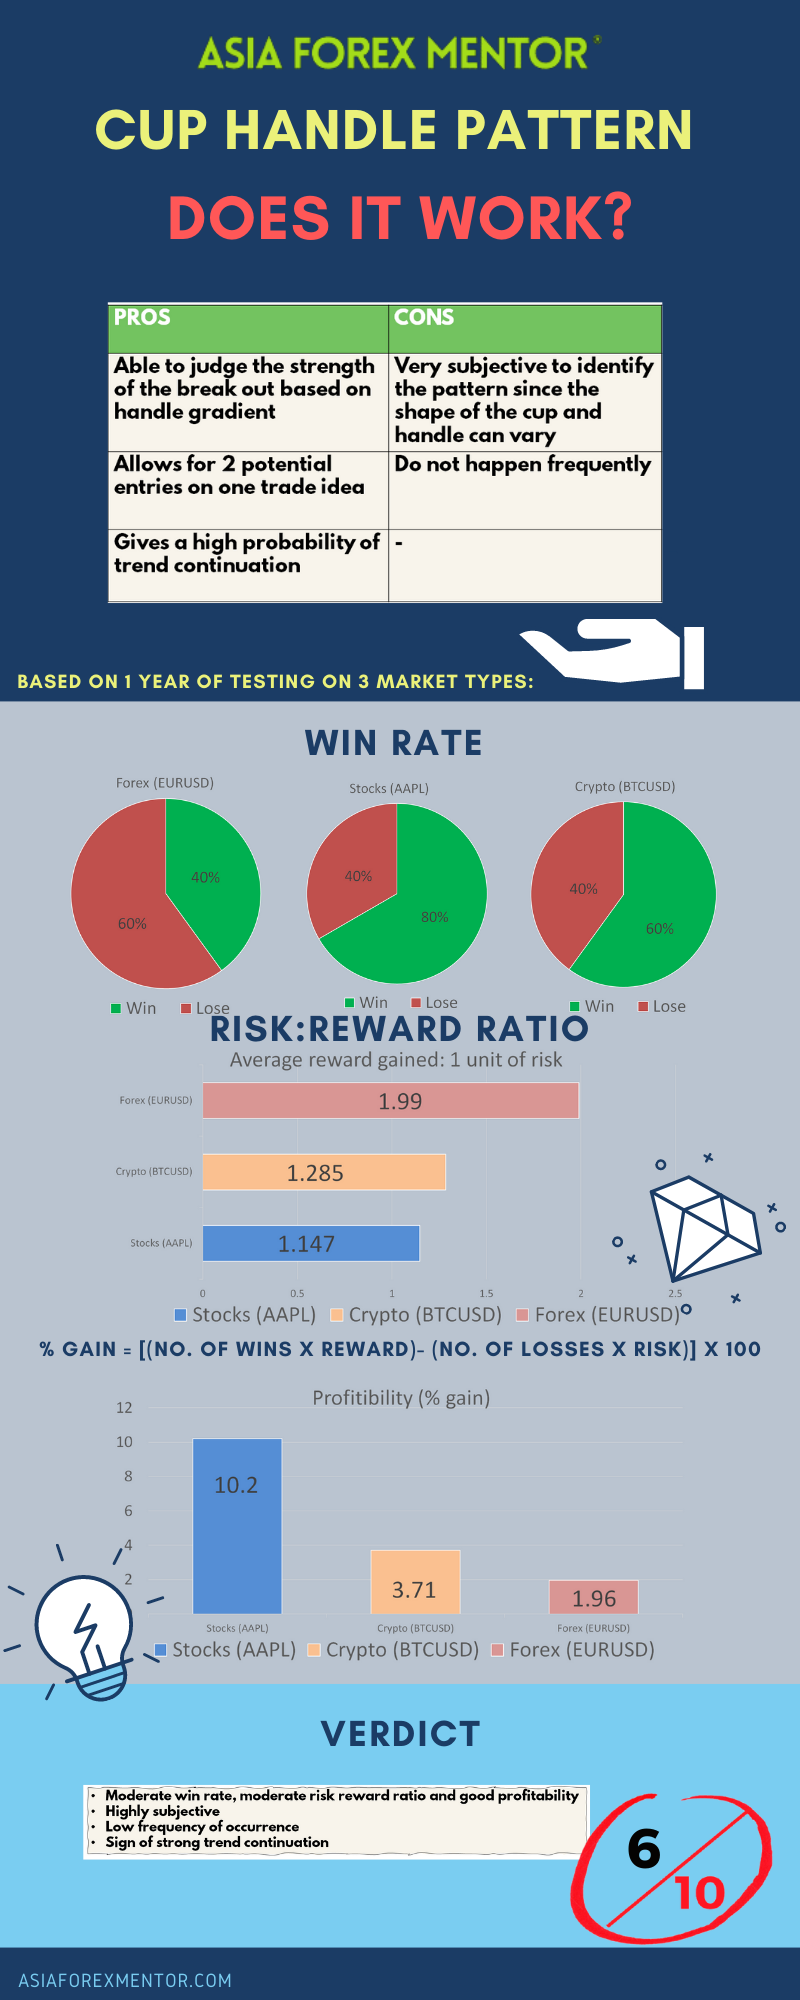
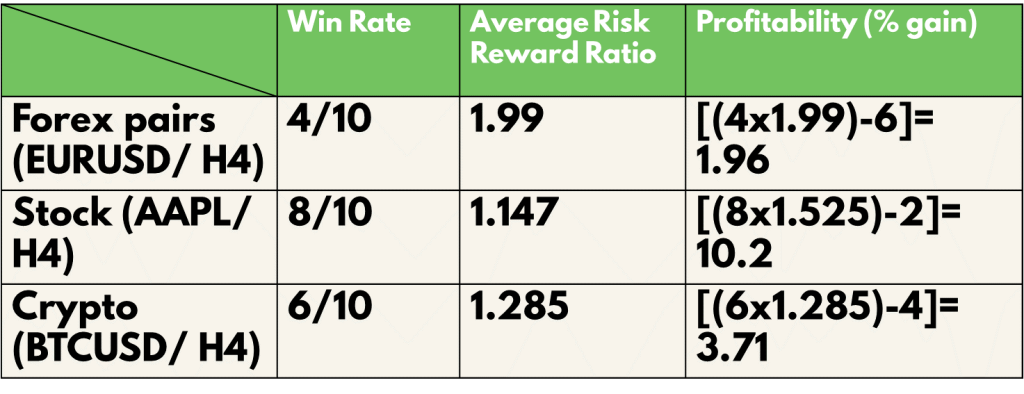
As shown in our backtest, the win rate of this strategy for EURUSD (Forex) is 40%, AAPL (Stocks) is 80% and BTC (Crypto) is 60%
The average risk reward ratio of this strategy for EURUSD (Forex) is 1.99, AAPL (Stocks) is 1.147 and BTC (Crypto) is 1.285.
The profitability of this strategy for EURUSD (Forex) is 1.96, AAPL (Stocks) is 10.2 and BTC (Crypto) is 3.71.
Also read: Simple moving average trading strategy
Conclusion
In conclusion, the cup handle pattern strategy is an overall stable trend continuation strategy with an average win rate and average risk to reward ratio as well as good profitability. However, it does not take occurrence often in the market. This pattern strategy can definitely be improved further with the help of indicators as well as support resistance lines. It is important to note that this strategy is also extremely subjective. Common mistakes traders would make is by missing out on the cup and handle pattern as they can appear in different shapes. Also, more often than not, there might be some anomalies during the consolidation when the cup is forming. Therefore, it is important to note that as long as prices don’t break the resistance at the rim of the cup, the pattern will still hold. On top of that, just like any other chart pattern, it is important to rid your emotions and wait for a confirmation instead of placing unnecessary pending orders that get triggered and later stopped. Always wait for the closure of the candle to be above the lines as a confirmation before making a play.
Info
