Financial markets display various trading patterns. These price patterns can be used to speculate market price direction as they occur repeatedly and behave similarly. One of the most common types of trading patterns is known as harmonic trading patterns. This is a group of several reversal patterns characterized by the Fibonacci retracement and extension levels.
Other than the crab pattern other patterns in the harmonic family include the Gartley pattern, the bat pattern, the AB CD pattern, and the butterfly pattern. All these patterns get their structure from using the Fibonacci tool as a retracement tool.
In this article, we have discussed in detail the crab harmonic pattern as it is one of the most popular harmonic patterns. By the end of the article, you will learn what a crab pattern is, how to spot it, and finally, some tips on how to trade the crab pattern.
Also read: Harmonic Patterns: A Complete Guide
Contents
- What Exactly is the Crab Pattern?
- How to Identify the Harmonic Crab Pattern
- Bullish Crab Pattern
- How to Trade the Bullish Crab Pattern
- Bullish Crab Pattern Setup
- Bearish Harmonic Crab Pattern
- Deep Crab Pattern
- Conclusion
- FAQs
What Exactly is the Crab Pattern?
The crab pattern is a 5-point precise harmonic pattern that depends on certain Fibonacci ratios to validate its structure. It is a reversal pattern and is part of the larger harmonic pattern family. It is distinguishable in that it allows traders to enter the markets in areas where there is a volatile price action i.e., extreme highs or lows.
The crab pattern is characterized by five points which are conventionally labeled as X, A, B, C, and D. These points then form its price legs which are labeled as XA, AB, BC, and CD. The most distinguishable trait that sets it apart from other harmonic trading patterns is that it has a very sharp CD price swing.

How to Identify the Harmonic Crab Pattern
As mentioned above harmonic patterns need to meet specific Fibonacci ratios and retracements to validate their structure. Therefore, you need to confirm the following extensions and retracements to confirm that a harmonic pattern is indeed a crab pattern.
- Price leg AB the retracement of the XA leg should retrace between 38.2% and 61.8%. Point B should always be below the 0.618 Fibonacci retracement level.
- Price leg BC extends between 38.2% and 88.6% Fibonacci levels of the prior AB leg.
- In any variation of the crab pattern point, C should never o past point A.
- The AB price leg should always be a countermove to the prior X A leg.
- The CD price leg should reverse the B C leg to Fibonacci ratios of between 224.0% and 361.8% of the B C leg. Additionally, it should reverse up to 161.8% of the XA initial price leg.
The crab pattern is almost similar to the butterfly harmonic pattern. However, the crab pattern has a larger extension of the B C leg compared to the butterfly pattern. The D points in crab patterns are known as potential reversal zones. Reversal begins immediately after the formation of these points.
The above Fibonacci levels are the backbone of the crab harmonic pattern. Therefore, unless all the above requirements are met, do not classify a harmonic pattern as the crab pattern. Using the crab pattern trading strategy for another pattern could potentially lead to significant losses.
Today, any decent trading platform will have a harmonic indicator. A harmonic indicator is a complex instrument that will help spot and verify if a pattern is a harmonic pattern. This simplifies your work on technical analysis of the markets.
Bullish Crab Pattern
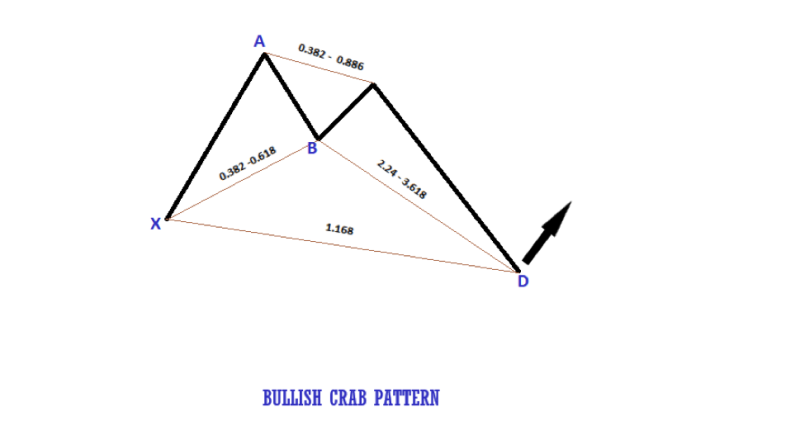
The above illustration is a bullish crab harmonic pattern. You can verify whether it has a valid structure from the labeling and the various harmonic Fibonacci levels.
- Leg XA – This is the initial price leg. Prices increase from the X point to point A in a steady but clear move. Point is the peak point of the bullish crab pattern as it signifies the highest price levels.
- Leg AB – This is a retracement of the initial XA price swing. During this stage, prices fall but only to a portion of the XA leg. It should retrace to about 38.2% of the X A leg. The B point is a key area of the crab pattern and should always be above point X.
- Leg BC – During this stage prices start to rise in a sharp movement again but will not rise past point A. The extension values of point C from point A should be between 38.2% and 88.6%.
- Leg CD – This is the final and most important leg of the bullish crab pattern. Here price action falls to point D in a steady but clear move. From the B point, the CD leg should extend between 224% and 361.8%.
D point is referred to as a potential reversal zone. This zone is usually very volatile; hence you need to be vigilant so as not to miss your entry. Your entry position should be a buy order with two potential take-profit targets. These two take-profit targets are point B and point C, respectively. At either of the two points, the price action could always reverse hence the need to take profit.
How to Trade the Bullish Crab Pattern
While there is no specific set method of trading the bullish crab pattern, it is common knowledge that a reversal pattern; implies a counter-trend move in the market. This pattern typically points to an uptrend, hence it is used to figure out a buy order.
Since the crab pattern is an extreme harmonic pattern, it mostly forms on more volatile markets. For this reason, while trading using this strategy, be keen not to miss your entry point. Your ideal entry point would be close to the final and lowest point D. Make sure to get into the trade only when the Fibonacci level of D point from Point X is close to 161.8%. After getting in on the trade, your take profit target should be at region B and region C respectively.
Also Read: 12 Forex Reversal Patterns You Must Know
Bullish Crab Pattern Setup
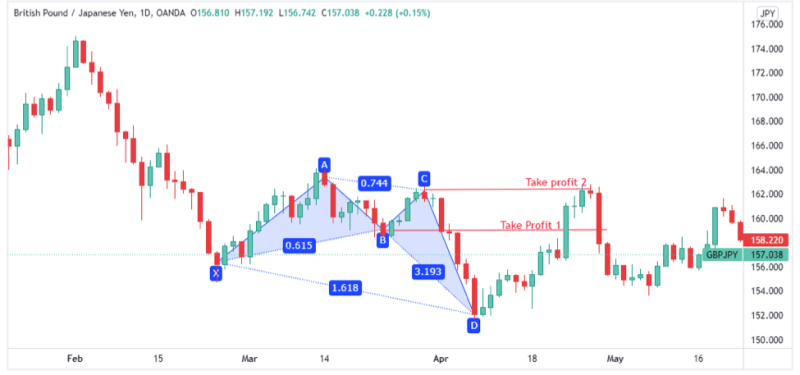
From the above image of a bullish crab pattern set up on the GBP/JPY price chart, you can tell that after the formation of point D the prices went up in a bullish manner.
The ideal entry point for the above trade would have been immediately after the formation of swing point D. To confirm that the D point has been formed accurately it should be at a Fibonacci ratio of 1.618 or close to the initial X A leg. Therefore, the buy order should have been during the first green candle after the D point at the 152.000 mark.
Since it is difficult to determine just how far the D point will be formed, it is advisable to set a protective stop loss at around the 150.000 mark. This ensures that you do not make any losses as you wait for the confirmation of point D.
The first profit target should be around region B (labeled as take-profit 1). The reason for this is that in this region the market direction could potentially reverse. The second take profit target should be around region C, labeled as ‘take profit 2' on the above image. This is another potential reversal zone, and as you can tell from the image above, the market direction reversed at this point.
Bearish Harmonic Crab Pattern
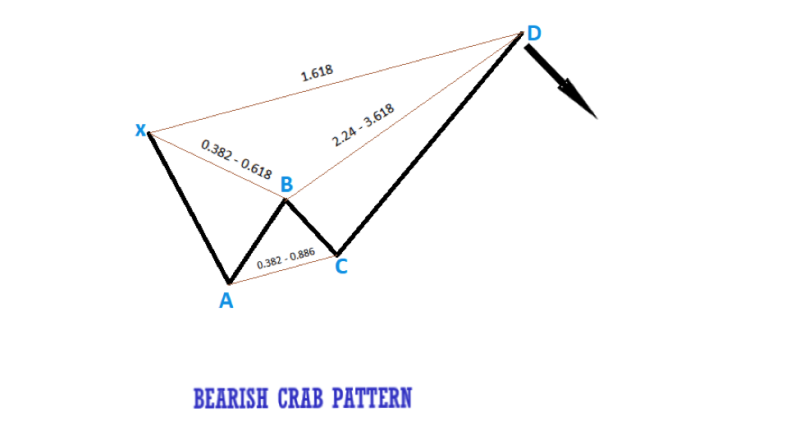
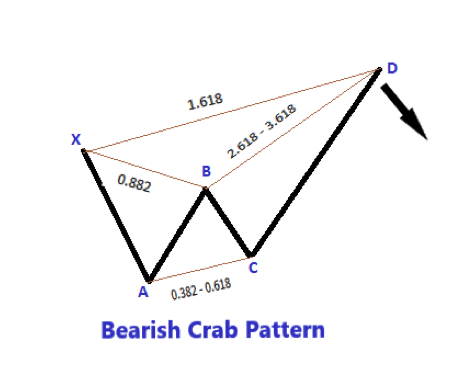
Above is an illustration of the bearish harmonic crab pattern.
Leg XA- This is the initial bearish price leg. Prices drop from point X to point A consistently.
Leg AB – This is the first retracement leg. Prices retrace the initial line AX but only to a Fibonacci retracement of between 38.2% to 61.8%. It is usually the first confirmation of a bearish harmonic pattern. Point A is usually the lowest point in the pattern.
Leg BC – This is the second bearish price leg but the third leg in the crab structure. During this stage, prices fall to between 39.2% to 88.6% of the prior AB leg. Point C should always be above point A.
Leg CD – This is the final and most important price leg of the crab pattern. Point D is usually the peak point of the bearish pattern and should extend to about 161.8% of the initial point X. As a confirmation, point D should fall between the Fibonacci levels of 224% to 361.8% 0f point B.
The bearish crab trading strategy is used to speculate a bearish movement in the market. Therefore, your sell order should be close to point D as it is the final point in the structure. This strategy is a dual take profit strategy with the first take profit at point B and the second take profit at point C.
How to Trade the Bearish Crab Pattern
As it is a reversal pattern, once a bearish crab pattern is formed it signifies a potential bearish price action. While there is no specific method to trade this specific pattern, here are some tips that have proven successful to traders using the crab pattern strategy.
The ideal entry point would be close to or after the formation of the final point D (potential reversal zone). Confirmation of this point would be a Fib ratio of 161.8% or close to of Point D from Point X or Fib levels of between 224% to 361.8% of D point from B. The former is considered more accurate. Below is a more practical example of how to trade the bearish pattern of the crab strategy.
Bearish Crab Pattern Setup
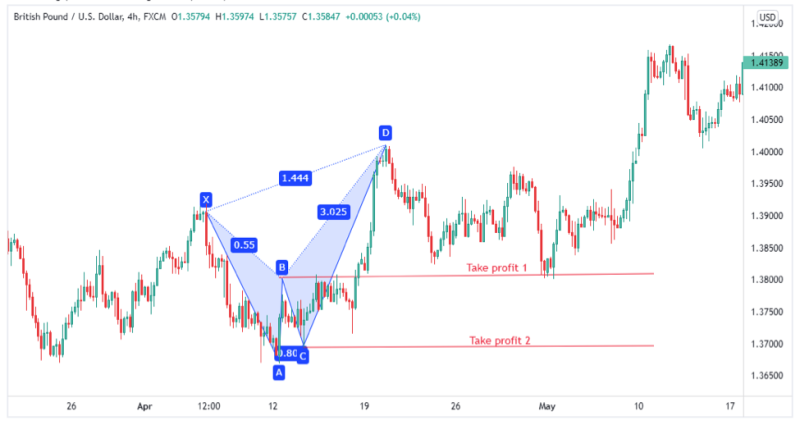
Above is a practical illustration of the bearish crab pattern in the GBP/USD chart in a 4-hour time frame. This is visible after the formation of the D point, where the market then behaves in a bearish reversal.
The ideal entry point (with a sell order) for the above trade would have been close to the final point D. If you chose to enter before a clear bearish movement, it is always advisable to put a protective stop loss just in case the market continues on an uptrend. The ideal stop point would have been just above or at the 1.40500 mark.
The first take profit should have been on around the B region and is marked as ‘take profit 1’. In our case above the market reversed at this point. Therefore, this illustration stresses the need to take profit at region B as it is a potential zone for reversal.
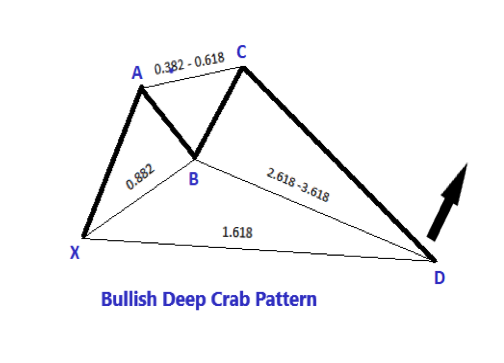
Deep Crab Pattern
The deep crab pattern is a variation of the crab pattern, but with a minor change in Fibonacci levels of swing B. For the deep crab pattern, the B point retracement of the initial XA leg goes up to 88.6% while in the normal crab pattern it retraces to between 38.2% and 61.8%. The deep crab pattern is also characterized by five swing points and four price swings.
The following are the Fibonacci levels used to confirm a deep crab pattern.
- Swing point B retraces to 88.6% of the initial X A leg.
- The B C leg extends to between 38.2% and 88.6% of the prior AB price leg.
- The final CD price leg reverses up to 161.8% of the XA leg and between 261.8% to 361.8% of the B C leg.
Below are both the bullish and bearish illustrations of the deep crab pattern. Deep crab patterns are traded in a similar way to regular crab patterns. For example, a bearish deep crab pattern will be handled in a similar way to the bearish crab while following the above rules.
Conclusion
Harmonic trading and especially using the crab harmonic strategies have proven to be profitable when done correctly. To correctly identify crab patterns, most traders use technical indicators, specifically created for harmonic trading. These indicators help identify and confirm harmonic patterns.
The crab pattern is commonly confused with the butterfly harmonic pattern. For this reason, If you intend to participate in the market using harmonic trading strategies, it is best to educate yourself on other harmonic patterns. A good harmonic trader can spot the difference between a butterfly pattern and a crab pattern.
FAQs
How profitable is harmonic trading?
Compared to other trading strategies, harmonic trading allows traders to achieve profits, especially when used correctly. Additionally, because it is a dual profit trading strategy, it enables traders to evaluate a better risk to reward ratio.
How many impulsive legs do harmonic patterns have?
Out of the four legs of harmonic price patterns, two are impulsive while two are retracement legs. The AB CD pattern is, however, a bit different as it only has three price legs.
What do you need to trade the crab pattern?
Whether you are forex trading or participating in the stock market, all you need is a harmonic indicator or scanner. This will help you spot and verify the crab harmonic patterns.