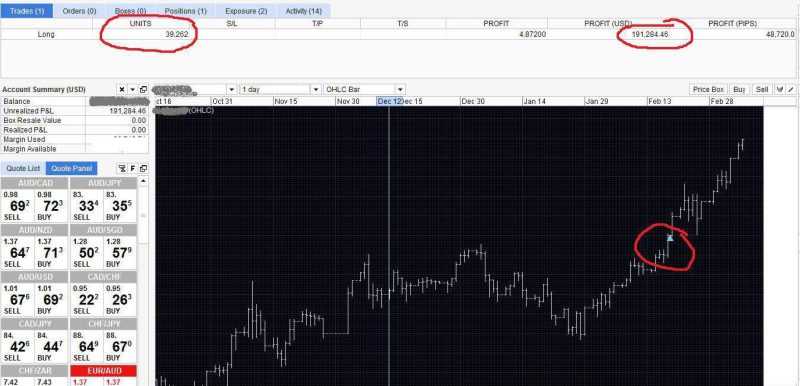
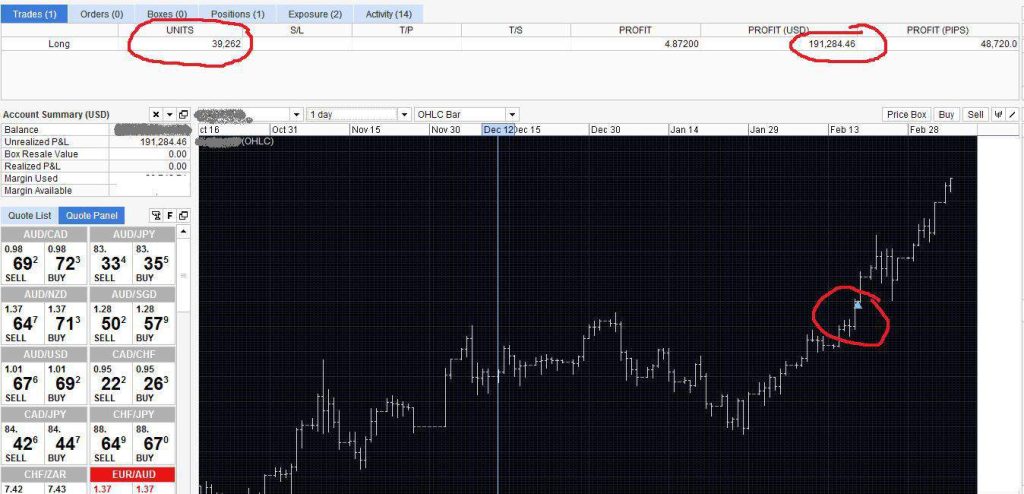
There’s a lot of money to be made in foreign exchange trading or trading stocks especially if you understand various patterns and can apply different trading strategies.
A chart pattern is the formation of candlesticks as a direct result of the price action of the underlying security. A trading strategy on the other hand is a method consisting of various styles and confluences that when used together increase your chances of being profitable. One such strategy is the channel pattern trading strategy, which is relatively easy to spot and trade.
In this article, we will discuss in-depth the channel trading strategy. You will learn what a trend channel is and how to trade various trend channels. As a bonus, we have shared some tips to use once you spot a trend channel.
Also Read: Candlestick Patterns Cheat Sheet
Contents
- What is Channel Trading?
- Support and Resistance Areas
- How to Trade the Channel Pattern
- Types of Trading Channels
- Conclusion
- FAQs
What is Channel Trading?
A trading channel is a price action pattern that is characterized by a uniform trend in the market where a security’s price usually trades between two parallel trend lines. The top line is known as the channel resistance while the bottom line is known as the channel support.
A trading channel is clear enough and easy to spot as the separation between the support and resistance parallel lines is large enough to profit from. Traders usually place buy orders at the support level and take sell orders at the resistance level as prices revolve around these two key levels.
Support and Resistance Areas
Channel trading heavily relies on support and resistance areas for its formation. A support line, usually the lower trendline, refers to a historical price level where the prices stop falling. At this point, bulls take over the market as bears refuse to sell below this price. Support levels usually form at price swing lows or the bottom of a trend showing a bullish price reversal.
A resistance level, usually the upper trendline, refers to a historical price level where prices stop rising. At this point, bears take over the market as bulls refuse to buy over the price. Resistance lines usually form at the top of the channel (swing highs) showing a bearish price reversal.
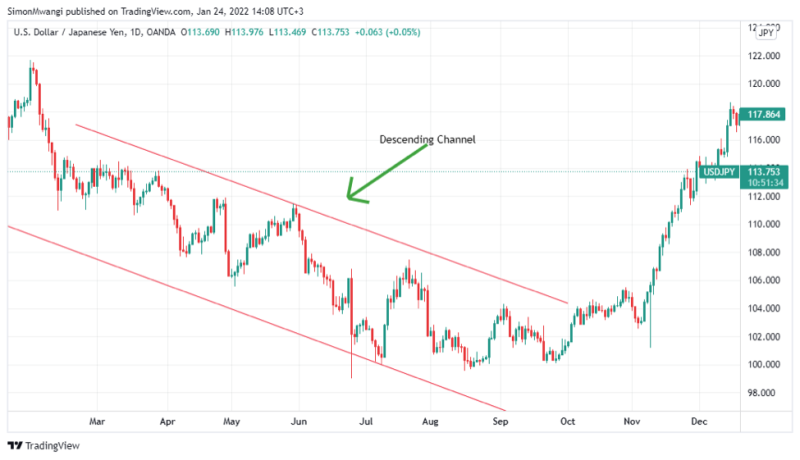
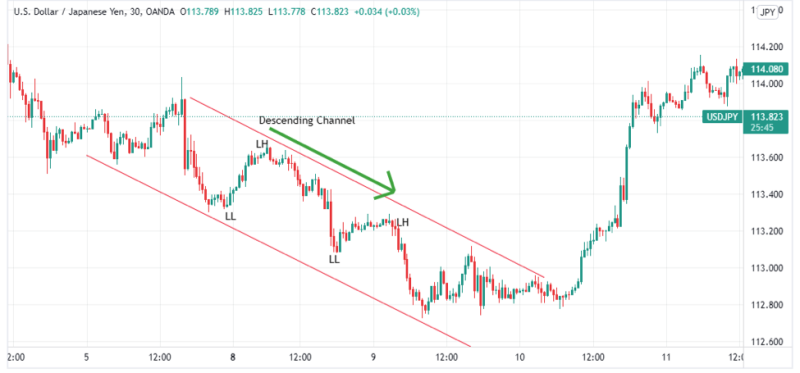
Below is an illustration of a descending chart pattern on the USD/JPY daily chart. Note the prices fell in s steady but consistent way making lower highs and lower lows at various support and resistance parallel lines.
How to Trade the Channel Pattern
The channel pattern trading strategy is straightforward and allows for proper risk management. Technical traders use the channel pattern either as a trend continuation pattern or as a break-out pattern.
As a trend continuation pattern, traders take trades in favor of the direction of the trend. In an uptrend (ascending channel) traders will take consistent buy orders especially at price swing lows (support). They will then take profit once the price gets close to the top of the channel. This is because they expect the price to continue rising in a steady manner and within the channel.
In a downtrend (descending channel) traders will take consistent sell orders especially at the top of the channel (resistance). This is because they anticipate that the prices will continue falling steadily within the channel.
Additionally, traders can also take trades in favor of the opposite direction during a trend. This is because prices tend to range between the support and resistance levels. For example, in an upward trend, a trader may choose to take a sell order when the price gets to a resistance level. They can then exit the trade once the price gets to or is close to the support level.
As a break-out pattern, many traders will wait for the market prices to exceed either the support or resistance level and take the trade in favor of the break-out. A breakout usually implies a huge price move and hence offers a better opportunity for traders to reap larger profits.
However, trading a channel breakout is considered risky as the breakout may not always proceed to maturity. While it is not that common, a breakout may experience price pullbacks i.e., if the breakout was bullish, it may experience a bearish price pullback whereas if the breakout was bearish, it may experience a bullish pullback. For this reason, it is advisable to always place a protective stop loss to protect your trade from any potential pullbacks.
Types of Trading Channels
Trading channels are labeled depending on the price action and market behavior of a specific asset. There are five main types of channel patterns. These include:
1. Ascending Channels
As the name suggests, an ascending channel refers to when an asset's price is continuously rising while paying attention to key support and resistance lines. It can also be referred to as a bullish trend.
In an ascending channel, many traders go long on the security being traded. Simply put most traders take buy orders and hope to benefit from the rise in the price of the underlying security. Other traders can open short positions, on the price of an asset especially when the price hits a resistance level. This helps them manage risk by hedging their long positions while maximizing their profits.
A rising channel is considered complete once the price breaks a resistance or support level. Ideally, this is usually an exit signal for traders. However, if the price breaks during a long position, the trader may choose to continue with the trade to maximize profits. Conversely, if the price falls below a support level, the trader may choose to short the asset in a bid to maximize profits or hedge their buy orders.
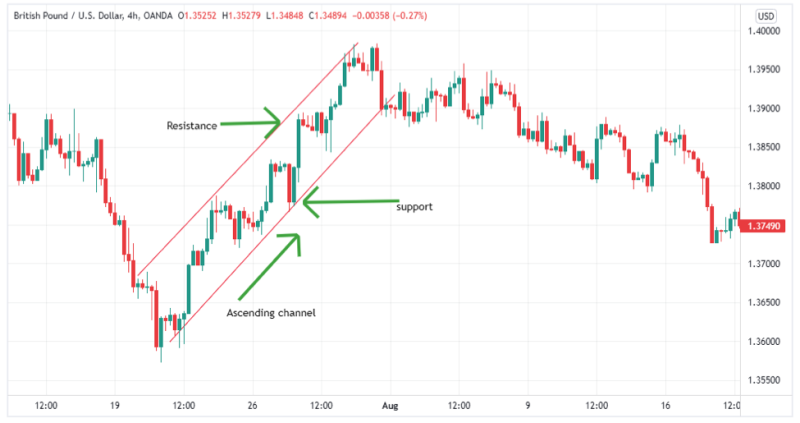
Below is an image that depicts an ascending channel in the GBP/USD 4-hour price series chart.
2. Descending Channels
As the name suggests the descending channel pattern occurs when the prices of a commodity are falling consistently. It can also be referred to as a bearish trend or a falling channel. Prices in a descending channel consistently form lower highs and lower lows.
Most traders take sell orders at resistance levels during a descending channel to ride the downward trend for profits. This is commonly referred to as short. Traders can open several short positions as prices keep on retesting the resistance level. Additionally, traders may also open short positions to hedge any long position they had in the market.
A descending channel is considered complete once the price breaks the resistance trendline and closes above a resistance level. At this point, traders have the option of opening long positions to make more profit.
Below is an illustration of a descending channel in the USD/JPY 30-min time frame forex chart.
3. Horizontal Channels
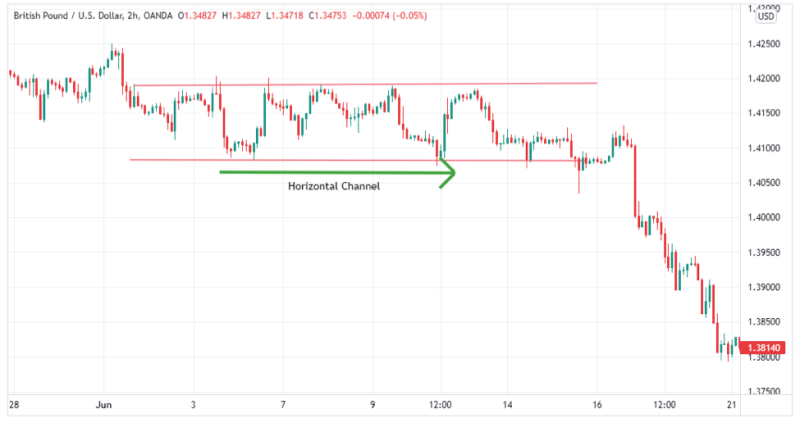
As the name suggests horizontal trading channels form when the prices of an asset are moving in a sideways manner. They can also be referred to as flat channels. The prices make consistent equal highs and equal lows over a specific period. Horizontal trading channels imply a sideways trend.
Usually, depending on price traders will enter the markets with either a long position or a short position. When the prices hit a resistance level, traders take this as a sell signal and therefore open short positions. Conversely, when the prices hit a support level, traders interpret this as a buy signal and hence open long positions.
Unlike the ascending trend channels and descending trend channels, prices rarely break the support and resistance of a flat channel. However, it is always advisable to have a protective stop loss or to be prepared to hedge against a trade if the breakout was to occur.
Below is an illustration of a horizontal trading channel on the GBP/USD chart.
4. Enveloping Channels
Enveloping channels are channels made up of two trend lines a standard deviation or average true range line and an enveloping central line which is usually a certain moving average. This is unlike all other trading channels which are made up of two parallel trendlines. Enveloping channels react to price in relation to market movement and volatility of price, hence the difference.
Enveloping price channels are therefore spotted through the use of a volatility indicator such as Bollinger Bands, Fibonacci Ratios, and Exponential Moving Averages (EMAs). Traders carry out technical analysis to determine the dynamic relationship between the above volatility indicators and the price of the underlying security.
Ideally, traders open long or short positions depending on which band the price breaks through. When the price rises through an upper band, traders interpret this as a buy order as they predict prices will continue rising. When the price falls below a lower band, traders interpret this as a sell order as they speculate the prices will continue falling.
A few examples of envelope channels include:
· Donchian Channels
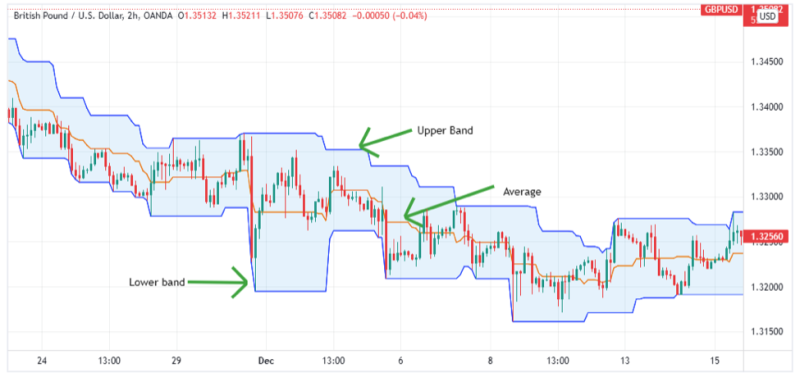
Donchian channels illustrate the relationship between the current price of the underlying security and its previous trading range. Evaluating this relationship helps traders determine price volatility and market movement. A donchian channel is made up of three bands, an upper band, middle band, and lower band.
The upper band illustrates the highest high during the trading period while the lower band illustrates the lowest low. The middle band is an average of the upper and lower bands. As mentioned above, if the price exceeds the upper band it serves as a buy signal whereas if the price exceeds the lower band it serves as a sell signal.
A donchian channel width will vary depending on how volatile the prices for a specific asset are. Below is an illustration of a donchian channel.
Also Read: What Are The Donchian Channels?
· Bollinger Bands
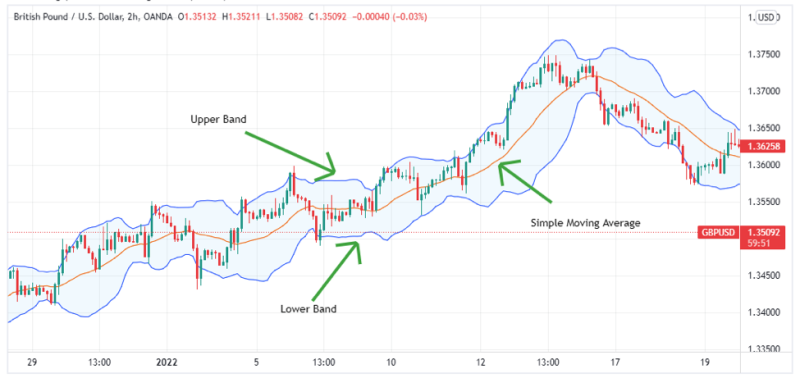
Bollinger bands are a technical indicator that helps identify support and resistance areas and evaluate the volatility of an asset's price. This technical indicator illustrates the relationship between the simple moving average (SMA) and various standard deviations. Just like the donchian channel Bollinger Bands are made up of three bands.
The width of the bands from the SMA on either side helps traders evaluate just how volatile a market is. A wider width illustrates a more volatile market while a narrow width illustrates a more stable market. For this reason, when the bands widen, traders speculate a retracement of the price action while when the bands narrow traders interpret this as a potential breakout of the price of an underlying asset.
However, using Bollinger bands has a drawback as it is a lagging indicator hence is only useful for confirming trends and cannot be used to allow early entries on a trade.
Other less popular enveloping channels employ the use of other technical indicators such as the Fibonacci Indicator, Kelter Channel Indicator, and Stoller Average Range Channel Bands
Conclusion
The channel trading pattern is quite popular as it fits well into most financial markets and different trading strategies. Additionally, it is applicable in its various variations as channels occur regularly and are sure to behave in the same way, an ascending channel will be characterized by higher highs and lower lows. In the case of a channel break out the direction of the market is clear and can be confirmed by the use of other technical indicators.
Technical analysts figured out that if you can analyze previous trading ranges, you can easily spot the channel pattern in its early stages. Spotting the pattern as it begins to form will give you several trading opportunities between the high and low prices. Depending on your investment objectives you can always decide whether to trade with the trend, against the trend, or both.
Kindly note that the information contained in this article is meant for educational purposes only and not as investment advice.
FAQs
How can you use channels to trade stocks?
Using a trading channel to trade stocks is similar to any other form of channel trading. Regardless of the chart pattern; whether the stocks form ascending channels, descending channels, or horizontal channels the key thing is to sell at resistance areas and buy at support areas.
How do you use trading channels?
There are two possible trading methods when trading a channel – either by trading a trend or by trading breakouts when the trend matures. While trading a trend, a trader will take a position consistent with the overall trend direction while trading a break out involves trading in favor of the channel breaks out.


