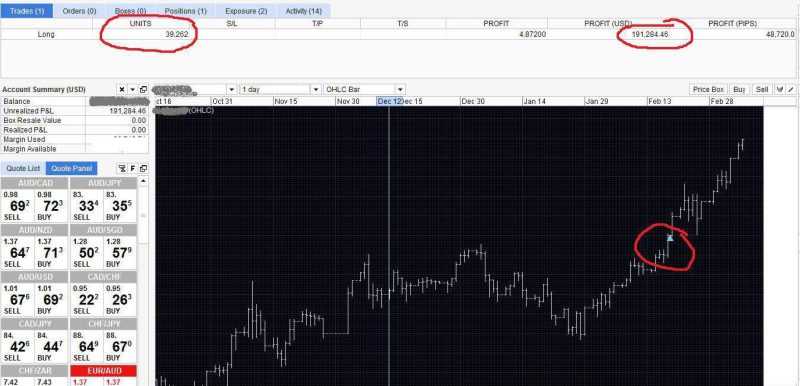
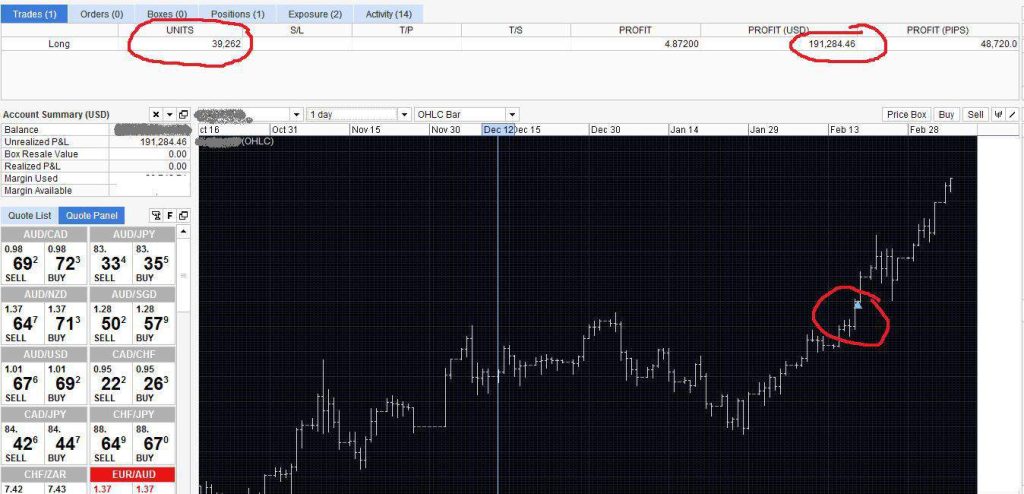
A Bull Pennant is a technical analysis chart pattern that appears in an uptrend and is considered to be a bullish continuation pattern.
This pattern is characterized by a narrowing price range and converging trendlines, which resemble a symmetrical triangle or a “pennant” shape. The price action forms a flagpole, which is the sharp move preceding the consolidation period, and a pennant, which is the congestion period of the pattern.
One of the key features of the Bull Pennant pattern is that it signals a pause in the current uptrend, during which prices are consolidated. In this case, the narrowing of the price range creates a symmetrical triangle that indicates a potential continuation of the uptrend.
The Bull Pennant pattern is considered a bullish signal because it suggests that the underlying asset will resume the rally within the direction of the prior trend (uptrend) after the pennant is resolved. Traders often watch for a breakout above the upper trendline of the pennant as a signal to enter long positions.
Also Read: What is the FOMC?
Contents
- What Is A Bullish Pennant Pattern?
- How to Recognize and Use the Bull Pennant in Foreign Exchange Trading
- Bullish Pennant Trading Strategy
- Formation Of Bullish and Bearish Pennants
- Pros And Cons of Bull Pennant Chart pattern
- Bottom Line
- FAQs
What Is A Bullish Pennant Pattern?
The bull pennant pattern is a technical indicator indicating an uptrend's continuation. It consists of one or more price breaks that move upward, especially when a market consolidates. Given that it typically occurs before an upward extension, the bullish pennant is one of the most powerful continuation patterns.
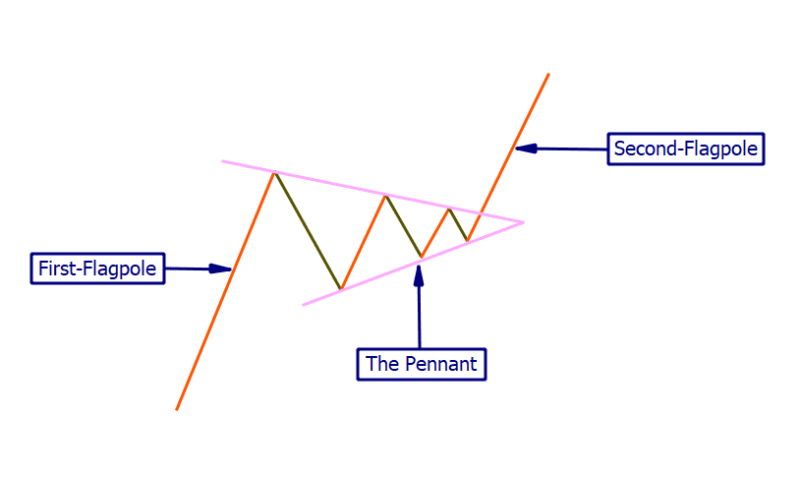
The pattern resembles bullish flags, with an upward trend (flag pole) and a period of sideways price activity (pennant). Instead of a flag, the bull pennant has convergent trendlines that create a triangle. It is frequently seen as a purchase signal and a means of joining current positive trends.
How to Recognize and Use the Bull Pennant in Foreign Exchange Trading
- Identify an uptrend: The first step in identifying a Bull Pennant pattern in forex trading is to look for an established uptrend in the currency pair you are analyzing.
- Locate the flagpole: The flagpole is the sharp upward move that precedes the consolidation period. It is typically steep and occurs in a relatively short period of time.
- Identify the pennant: The pennant is the period of consolidation that follows the flagpole. It is characterized by a narrowing price range and converging trendlines that resemble symmetrical triangles. The pennant should be smaller than the flagpole, and prices should be contracting, getting tighter and tighter.
- Watch for a breakout: The Bull Pennant pattern is resolved by a breakout, either above or below the trendlines of the pennant. A bullish breakout would occur when prices break above the upper trendline of the pennant. This is the point at which traders would look to enter long positions.
- Use other technical analysis tools: When identifying a Bull Pennant, it is important to use other technical analysis tools, such as trendlines, volume, and indicators, to confirm the pattern and increase the likelihood of a successful trade.
- Set stop-loss and take-profit: Once you have entered a long position based on a Bull Pennant breakout, it is important to set stop-loss and take-profit orders to manage your margin carries significant risk. A stop-loss order should be placed below the lower trendline of the pennant, while a take-profit order can be placed at a previous resistance level or using a multiple of the distance between the entry point and the stop-loss.
- Consider other market conditions: As with any trading strategy, it is important to consider the broader market conditions, including economic and political factors, when trading based on a Bull Pennant pattern.
It's ideal to remember that Bull Pennant, like other continuation chart patterns, does not always appear, and it is not a guarantee for specific price action. Therefore, It's important to use Bull Pennant pattern analysis in conjunction with other technical and fundamental analyses to make informed trading decisions.
Bullish Pennant Trading Strategy
A bullish pennant chart pattern is a formation that appears after an extended uptrend. It is marked by two converging trend lines that form a symmetrical triangle pattern, with the lower trend line sloping upwards and the upper trend line sloping downwards.
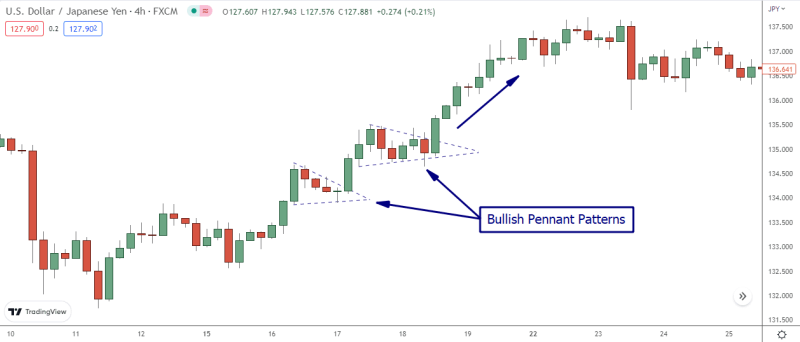
It signals a period of consolidation and can be a potential signal for continuing the upward trend. To use the bullish pennant pattern in foreign exchange trading, traders can look for a strong uptrend in a currency pair, followed by a period of consolidation with a pennant pattern appearing in the continuation price structure.
If the price breaks out and closes above the upper trend line, it can signal a continuation of the upward trend, allowing the trader to enter a long position.
It's important to note that the Bullish Pennant is a continuation pattern. The price is expected to continue to move in the same direction as the previous trend. Therefore, a bullish pennant is more likely to occur during an uptrend and less likely to occur during a downtrend.
Also Read: How to Use Fibonacci Retracement?
Formation Of Bullish and Bearish Pennants
Bullish and Bearish Pennant patterns are similar in that both are formed by a consolidation period following a sharp move in price, and both are considered continuation patterns. However, there are several differences in the formation of Bullish and Bearish Pennants.
Formation of Bullish Pennant
- Occurs in an uptrend
- The flagpole is the sharp upward move that precedes the consolidation period
- The pennant is the period of consolidation that follows the flagpole, and it's characterized by a narrowing price range and converging trendlines that resemble a symmetrical triangle.
- A Breakout of the pattern is expected to occur above the upper trendline, and it's considered a bullish signal.

Formation of Bearish Pennant
- Occurs in a downtrend
- The flagpole is the sharp downward move that precedes the consolidation period
- The pennant is the period of consolidation that follows the flagpole, and it's characterized by a narrowing price range and converging trendlines that resemble a symmetrical triangle.
- Breakout of the pattern is expected to occur below the lower trendline, and it's considered a bearish pennant.
In both cases, as with other chart patterns, these patterns are not always present, and they may not guarantee a specific outcome, so it's important to use Bearish and Bullish Pennants pattern analysis in conjunction with other technical and fundamental analyses to make informed trading decisions.
Pros And Cons of Bull Pennant Chart pattern
Pros of Bull Pennant
- Bullish pennant patterns are considered continuation patterns, indicating that the price will likely continue in the direction of the previous trend.
- The symmetrical triangle shape of the pattern makes it easy to identify and trade.
- The pattern often forms after a strong upward move, making it a potential signal for a continued bullish trend.
Cons of Bull Pennant
- The pattern is not always reliable and can be subject to false breakout.
- The pattern can take a while to form, and traders may miss out on potential profits if they do not enter the market in time.
- The pattern can be easily mistaken for other patterns, such as symmetrical triangles or flags. It's important to use other technical and fundamental analyses to confirm the pattern before making a trade.

It's also important to remember that technical analysis is not infallible, and past performance is no guarantee of future results. Even with a bullish pennant pattern, traders should still use caution and risk management techniques when making a trade.
Bottom Line
Overall, Bull Pennants can be useful for traders looking to identify potential buy and sell signals and make informed trading decisions. By recognizing these patterns, traders can look for patterns consistent with the current asset trend they are analyzing and make predictions about future price movements based on historical price action. Incorporating Bull Pennants into their analysis along with other technical indicators and fundamental analysis can increase the accuracy of predictions and make more profitable trades. It's important to remember that past performance is not always indicative of future results, so Bull Pennant patterns should always be used in conjunction with other tools and analyses to make informed decisions.
Continuation patterns in trading can help traders identify potential trades and predict the continuation of a current trend, allowing them to make informed decisions and potentially increase their profits. They can also help traders to identify key levels of support and resistance and to set stop-loss and take-profit orders.
FAQs
What does a Bull Pennant Mean?
Bull Pennants are bullish continuation patterns that indicate an extension of the uptrend when periods of consolidation are over. The pennant uses two parallel lines to consolidate prices until prices break down.
How Reliable is a Bull Pennant?
The pennant pattern is commonly seen next to the bull and bears flag patterns on a textbook, although nobody has spoken of its low success. The flag is no exceptional pattern, and the pennant is well below that percentage.
What Happens After a Bull Pennant?
If a bull pennant is accurate, it will indicate that a bull trend is still in effect, and once the pattern is finished, the price will increase.


