Note: The information in this article is not investment advice. The opinions and ideas in this article are not a substitute for traders’ analyzing their own investments or seeking professional advice. In addition, traders who decide to adopt the ideas or strategies listed in this article, do so at their own risk.
Breakout trading is done when an asset’s price movement breaks through the resistance or support level of the asset during the trading session. Traders can then go long or short on the asset and exploit the anticipated price movements after the breakout for financial gain.
Charting well-known breakout patterns is easier for novices and inexperienced traders to find and exploit for financial gain. These chart patterns are easier for them to spot, and there are a variety of technical indicators that can be used to identify them and distinguish them from one another. These tools and increased awareness of how the patterns develop in market charts enhance the reliability of traders’ guesses/intuition and enables them to manage their market positions with greater insight and skill.
Also Read: Elliott Wave Analysis: Zigzag and Flat patterns
Contents
- What is a breakout?
- Why do traders like breakout trading?
- False Breakouts
- Defined Price Range: Support and Resistance Levels
- Phases of Breakout Trading
- Market Signs of a Potential Price Breakout
- Types of Breakout Chart Patterns
- How to Trade Breakout Stocks
- Key Takeaways
- FAQs
What is a breakout?
A breakout occurs when a price movement moves above the resistance level or below the support level. They can occur in any kind of market (e.g., stock, cryptocurrency, commodities). In addition, they can be tracked using breakout trading technical indicators.
Why do traders like breakout trading?
Traders like breakouts because they indicate when an old trend is ending and a market trend is beginning. When traders enter into the market at the beginning of a trend, they have the opportunity to maximize their return on investment, acquire an asset at the lowest market cost possible, and sell off their assets before the market price drops too low for them to recover their initial investment.
Another option that sophisticated traders may exploit is to offer traders trapped in the market or facing devastating financial losses a chance to reduce their losses by offsetting them with another investment. If the traders are panicked and/or desperate, they may be willing to purchase another trader’s assets that while not profitable will help to reduce the losses from their other investments. It is here that sophisticated traders can exit bad or poorly performing trades without losing money on them and shift their capital to better investments.
False Breakouts
False breakouts are also referred to as fakeouts. These occur when an asset’s price seems to be moving out of a defined range, but ultimately reverses itself. The price retracement means that the predictions based on the breakout are invalid and may lead to significant trading losses and/or be trapped in a weak trading position.
Sophisticated traders can earn returns by following and trading during false breakouts. This is a skill that must be honed. Traders working to develop this skill should be careful to limit their potential losses and not invest more than they can comfortably afford to lose in trades based on false breakouts.
For example, traders following and trading a false breakout will have a clearly defined price target. After they reach their price target, they will have the discipline to immediately exit their position, even if it appears that they could significantly increase their returns if they held their position longer.
Also Read: What is Channel Trading?
Defined Price Range: Support and Resistance Levels
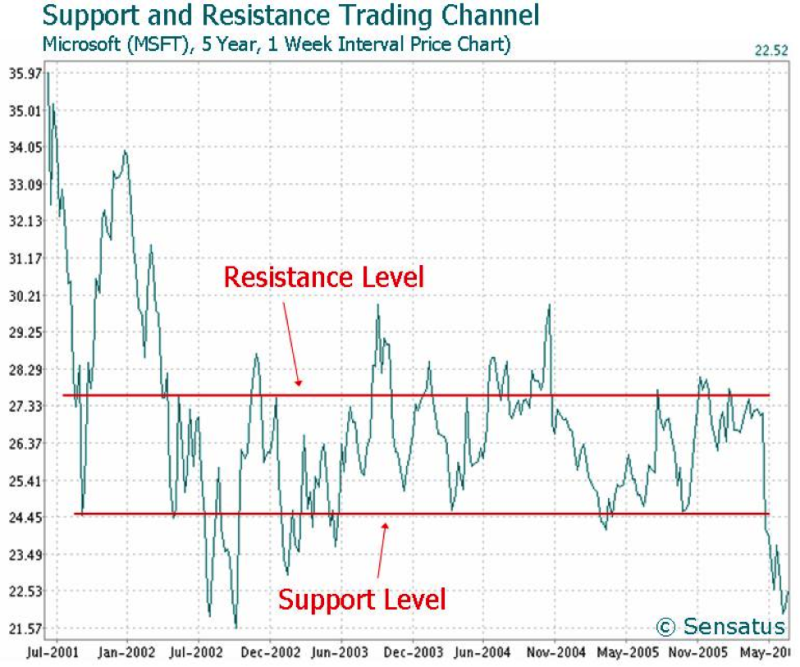
The price range of an asset is defined by its resistance and support level. When the price of the asset moves above the resistance level or below the support level, it is described as a price breakout. Price breakouts often, but not always, start new price patterns and trends.
Resistance Level
The resistance level is created by the market price highs. It is called a resistance level, because at that price level sellers are willing to sell off their assets, but there are not enough buyers to push the market price higher. To break through the resistance level, there must be strong demand from the buyers to overcome their overall reluctance to pay a higher market price for the asset.
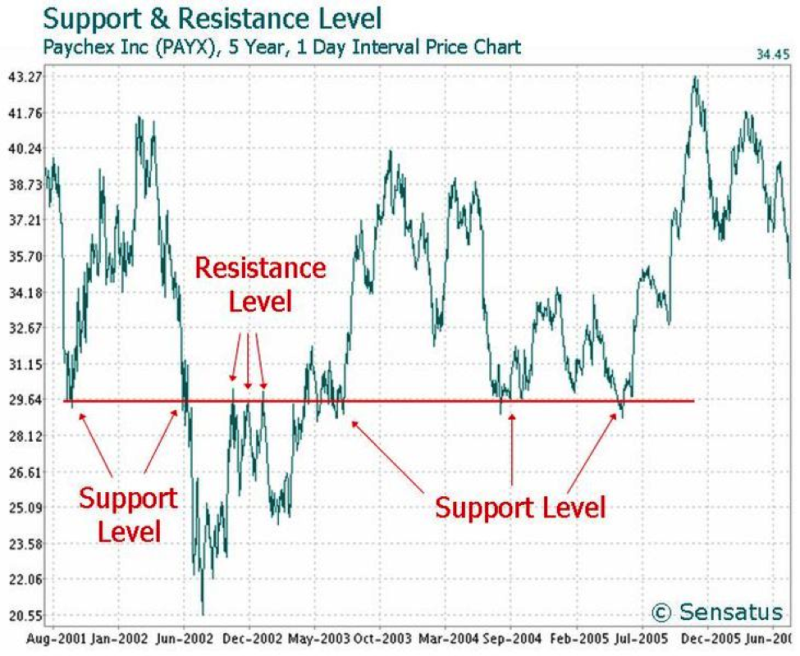
Support Level
The support level is created by the asset’s lowest market price(s). The support represents the market price at which most sellers are unwilling to sell off their assets, despite the presence of willing buyers. To break through this level, sellers must be motivated to sell their holdings despite taking losses on their liquidated assets.
Phases of Breakout Trading
There are four parts to a breakout in any financial market. The four parts are the resistance, support, breakout, and retest. The support and resistance lines establish the price range for the asset. The breakout is the movement of the price above the resistance level or below the support level. After the asset’s price breaks through its upper or lower boundary, it will likely retest itself. The next price trend will begin after the asset’s retest.
Retest
A retest occurs when the asset’s price retraces itself and moves back into the asset’s defined price range. After retracing itself, the price trend resumes its previous path.
Market Signs of a Potential Price Breakout
Breakout stocks have low volatility, low price movement, and tend to exhibit price consolidation. These characteristics along with immense market pressure to buy or sell a stock create an imbalance in the market. The restrained stock and push from sellers or buyers for the market to move creates prime conditions for a price breakout.
Whenever traders see consolidation trends, they can be certain that the asset’s price will break out of the narrowly defined price range with varying degrees of momentum. The momentum of the price movement will correlate to the force required to maintain the asset’s consolidation trend.
Types of Breakout Chart Patterns
Traders use technical analysis to identify buy, sell, reversal, and continuation patterns. The chart patterns that are most likely to produce a breakout are head and shoulders, triple tops, triple bottom, triangles, wedges, cup and handle, and flags. Note, different kinds of triangles, wedges, and flags can produce breakout trading opportunities.
Head and Shoulders Pattern
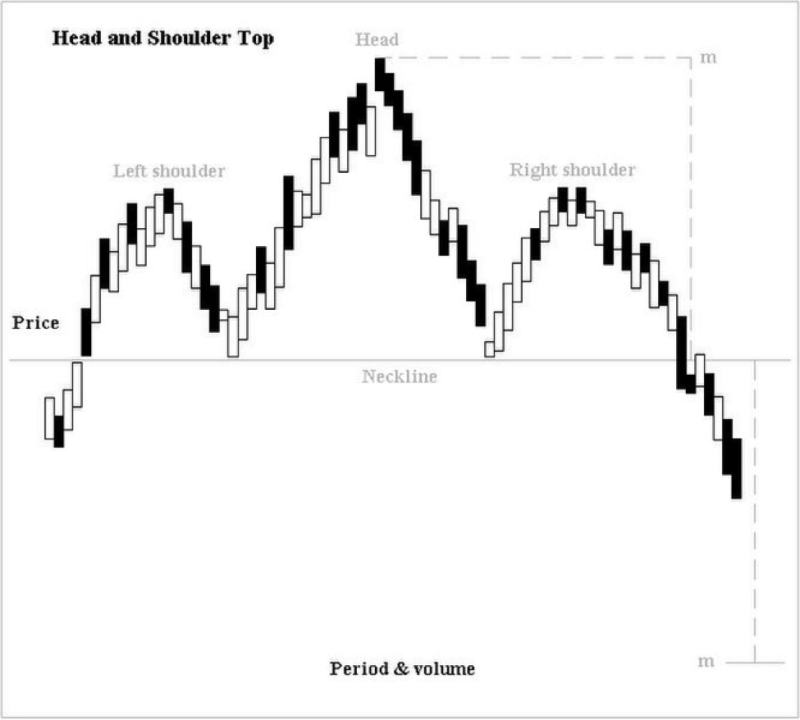
In this chart pattern, the asset’s price moves below the support level after the right shoulder. There are different types of head and shoulder patterns. If traders understand them, they can maximize their returns by being better able to predict when the price breakout will occur and the strength of the breakout.
Head and Shoulders Breakout Continuation Pattern
The head and shoulders chart pattern may have a continuation trend after the right shoulder and then have a price breakout. The trend may then move upward into a price consolidation trend before resuming its downward trajectory. It will be a bearish breakout.
Triangle Pattern

There are 3 types of triangle patterns that produce breakout patterns. The three patterns are ascending, descending, and symmetric. Triangles form when the price movement narrows across price swings. When analyzing triangles, remember that they can signal both continuation and reversal trends. In addition, triangle chart patterns can produce price patterns that are uptrends and downtrends.
Wedge Pattern
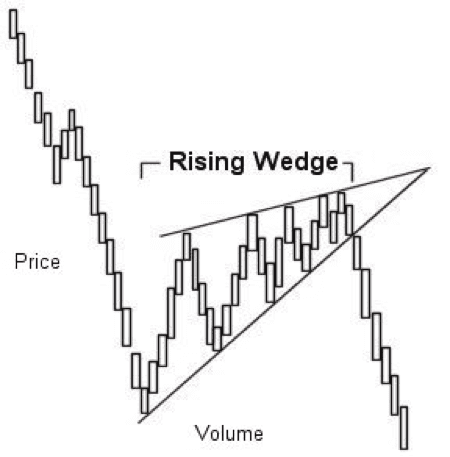
The support level of the wedge is angled upward, and its resistance level has a much shallower upward angle relative to the support level. If you extrapolate into the future, the two levels will intersect. The shallower resistance angle represents the market’s rejection of the buyers’ weak attempts to push the asset’s price upward. Just before the breakout, the market will fail to establish a new market price high. This is an important signal that there is an impending downtrend. It will be a bearish breakout.
Triple Tops and Triple Bottom Pattern
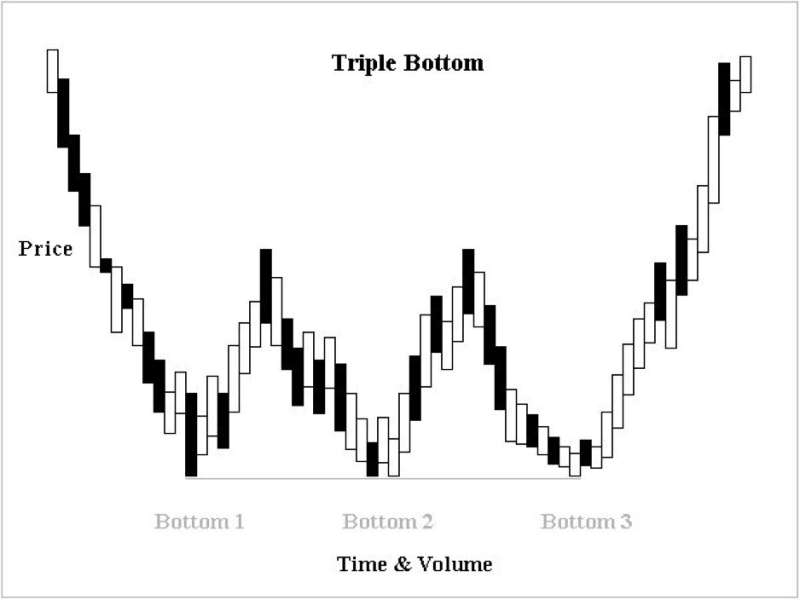
The triple tops and triple bottom patterns are both breakout patterns. The triple bottom is the opposite of the triple tops chart pattern.
For the triple bottom, after the third price low, the price will move upward and continue upward past the resistance level. This upward trending price movement will establish a new trend. It will be a bullish breakout. The price will continue to rise until buyers’ reject it (refuse to purchase the asset at that price).
For the triple tops chart pattern (not shown), after the third top, the price will trend downwards and continue past the support level. The downward moving price will establish a new price pattern after it breaks through the support level. It will be a bearish breakout.
Cup and Handle Pattern
The cup and handle pattern can be difficult for new and inexperienced traders to visualize when they look at market charts. Besides imagining the cup and handle, it can be difficult to understand how the same pattern can look very different depending on the price movements during that trading session.
Below, there are three different versions of the same chart pattern. They illustrate that the same pattern can look markedly different, though essentially have the same form.
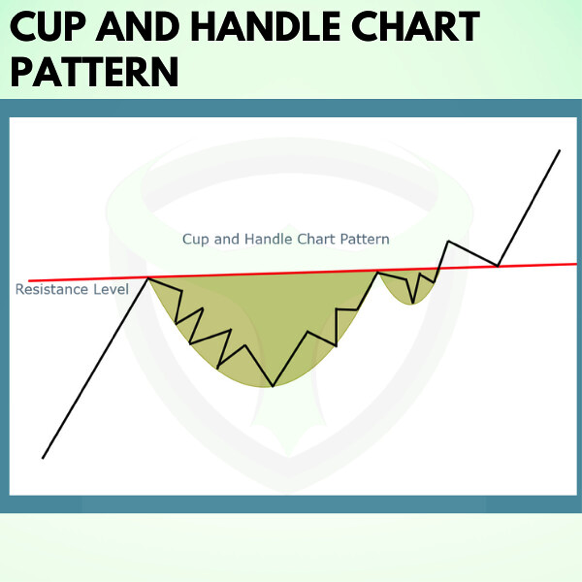
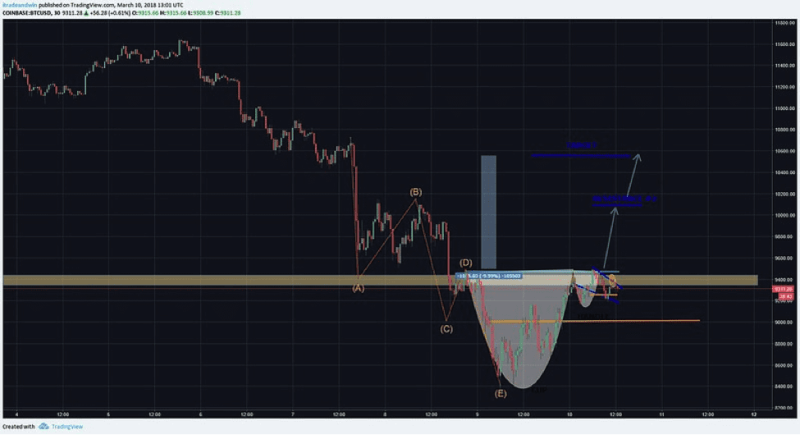
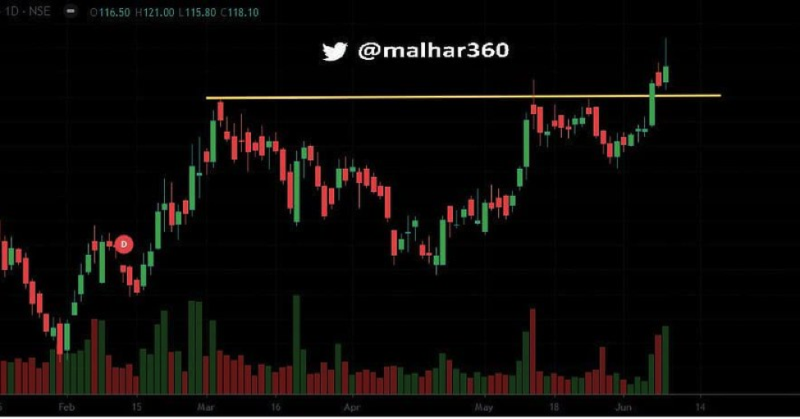
The cup bottom is formed when the price falls from the market high and rebounds to almost the same level repeatedly. After the cup pattern has been formed, the price consolidates sideways and forms the handle. The cup handle must be smaller than the cup bottom. In addition, it shouldn’t have a bottom that is lower than the cup’s bottom.
The cup and handle has two price peaks that touch the resistance level. The cup pushes into the resistance level because sellers lack sufficient strength to force the market price into a downtrend. Thus, the market price rebounds to previous highs and signals that the buying pressure will push the price through the resistance level. The breakout will occur when the buyers’ demands for the asset pushes the price through the resistance level. It will be a bullish breakout.
Second Chance Breakout Strategy
Traders enter the market after the breakout occurs, but delays entrance until the price moves and retests the original breakout point. This is often done to make sure that the breakout is not a phony breakout (a.k.a. fakeout).
How to Trade Breakout Stocks
Breakout stock trading can be especially lucrative for investors and traders. If the stock is becoming bullish, the trader can enter the market when its value is low, go long, and sell it when it has significantly increased in price and get a substantial return on the investment. On the other hand, if the stock is becoming bearish, traders can quickly liquidate their holdings or short the stock. Moreover, if the stock is expected to recover, they can buy large quantities of it at low prices and then sell it for a tidy profit when its market price rebounds.
Whether traders are buying breakout stocks to hold or trade for profit, the following strategy will help them meet with greater success in the market.
- Wait for the breakout to break through a resistance or support level. A lot of money can be lost if traders enter the market during a false breakout.
- Set defined price targets. Trends don’t last forever. Traders will want to exit their positions before the market moves against them.
- Use technical analysis to determine the stock’s price range. Next, based on the average price of the stock, traders will set their price targets and stops. This is when traders will determine the risk-reward ratio.
- Before entering a market position after a price breakout, traders should wait for a retest. Breakouts are equally risky and lucrative. Besides incorrectly predicting the future price movements of an asset, traders may misread the market and mistakenly enter a fakeout.
- Traders who want to trade breakouts can enter the market before, during, or after a retest.
- Fakeouts are the biggest risk factor when engaging in breakout trading. Breakouts fail when the price breaks through the level, but then falls back to a price with in the stock’s defined price range. If traders have mistakenly entered a fakeout, then they should exit their positions immediately or look for ways to reduce their financial losses.
- If traders are in a trade near the end of the trading session, they should exit the position before the market closes. Moreover, stock prices near market close represent the financial sectors’ general sentiment about the stock.
- Traders should exit their position when they have achieved their objective. If the trade is a winning one, then traders should hold their positions until they achieve their target price and/or time. They should not maintain their position any longer than that, regardless of how attractive it may be to maintain the position for a longer period of time.
Key Takeaways
Breakout trading is a popular way to make money as a price trend ends and a new one begins. Besides looking for assets that have low volatility, low price movement, and are in a consolidation pattern, the trader must verify that it is a true breakout. Moreover, breakouts can have different outcomes (e.g., uptrends, downtrends, continuation trends, reversal trends). Each price trend requires traders to make different market decisions. Traders are advised to look for confirmation of future price trends. The confirmation can come from a variety of technical indicators. These indicators are invaluable to traders because price trends are not always obvious when they are first developing and correction of trading errors can be costly, in terms of time and money.
FAQs
What is the breakout point for a stock?
The breakout point for a stock is the point, or market value, at which the asset’s market price moves across (or breaks through) the upper or lower boundary of its defined price range.
What are breakout stocks?
Breakout stocks are stocks that have market prices that have broken through their resistance or support levels.
What is a breakout strategy?
A breakout strategy is an investment strategy used to trade breakout stocks for profit. In addition, the strategies are intended to prevent the traders using them from making mistakes when entering trades (e.g., becoming trapped in weak markets, fakeouts).
Why is it important to look for a reversal pattern when trading a breakout stock?
Reversal patterns can occur in breakout trading. A reversal occurs after an asset’s price has been moving in one direction, consolidated, broke through the asset’s upper or lower boundary, and then moved in a direction that is the opposite of the previous trend. Traders must make a decision to go long or short and place stops in the appropriate places for a reversal trend. If the target price and stops are placed incorrectly, the trader may not make any money, or, even worse, lose a lot of money.
What is the difference between gap trading and breakout trading?
In breakout trading, the asset’s price breaks through the upper or lower boundary of the asset’s price range and starts a new price trend.
Gap trading is different because the asset’s price moves up or down during non-trading hours based on events or news that affect the market’s valuation of the asset. The gap does not always signal the beginning of a new price trend.


