In the world of financial markets and investment, candlestick patterns serve as a vital tool for technical analysis. Among these patterns, the bullish breakaway candlestick pattern stands out as an essential indicator for traders and investors. This article aims to explore what the bullish breakaway candlestick pattern is, its significance, how it contrasts with the bearish breakaway pattern, and its role in trading strategies.
What are Candlestick Patterns?
Candlestick patterns are graphical representations of price movements in financial markets. They originated from Japanese rice traders in the 18th century and have since become a cornerstone of technical analysis. Each candlestick provides information on the open, high, low, and close prices of a specific trading period, typically a day. Traders use these patterns to predict future price movements based on historical data.
Also Read: The 28 Forex Patterns Complete Guide
Bullish Breakaway Candlestick Pattern
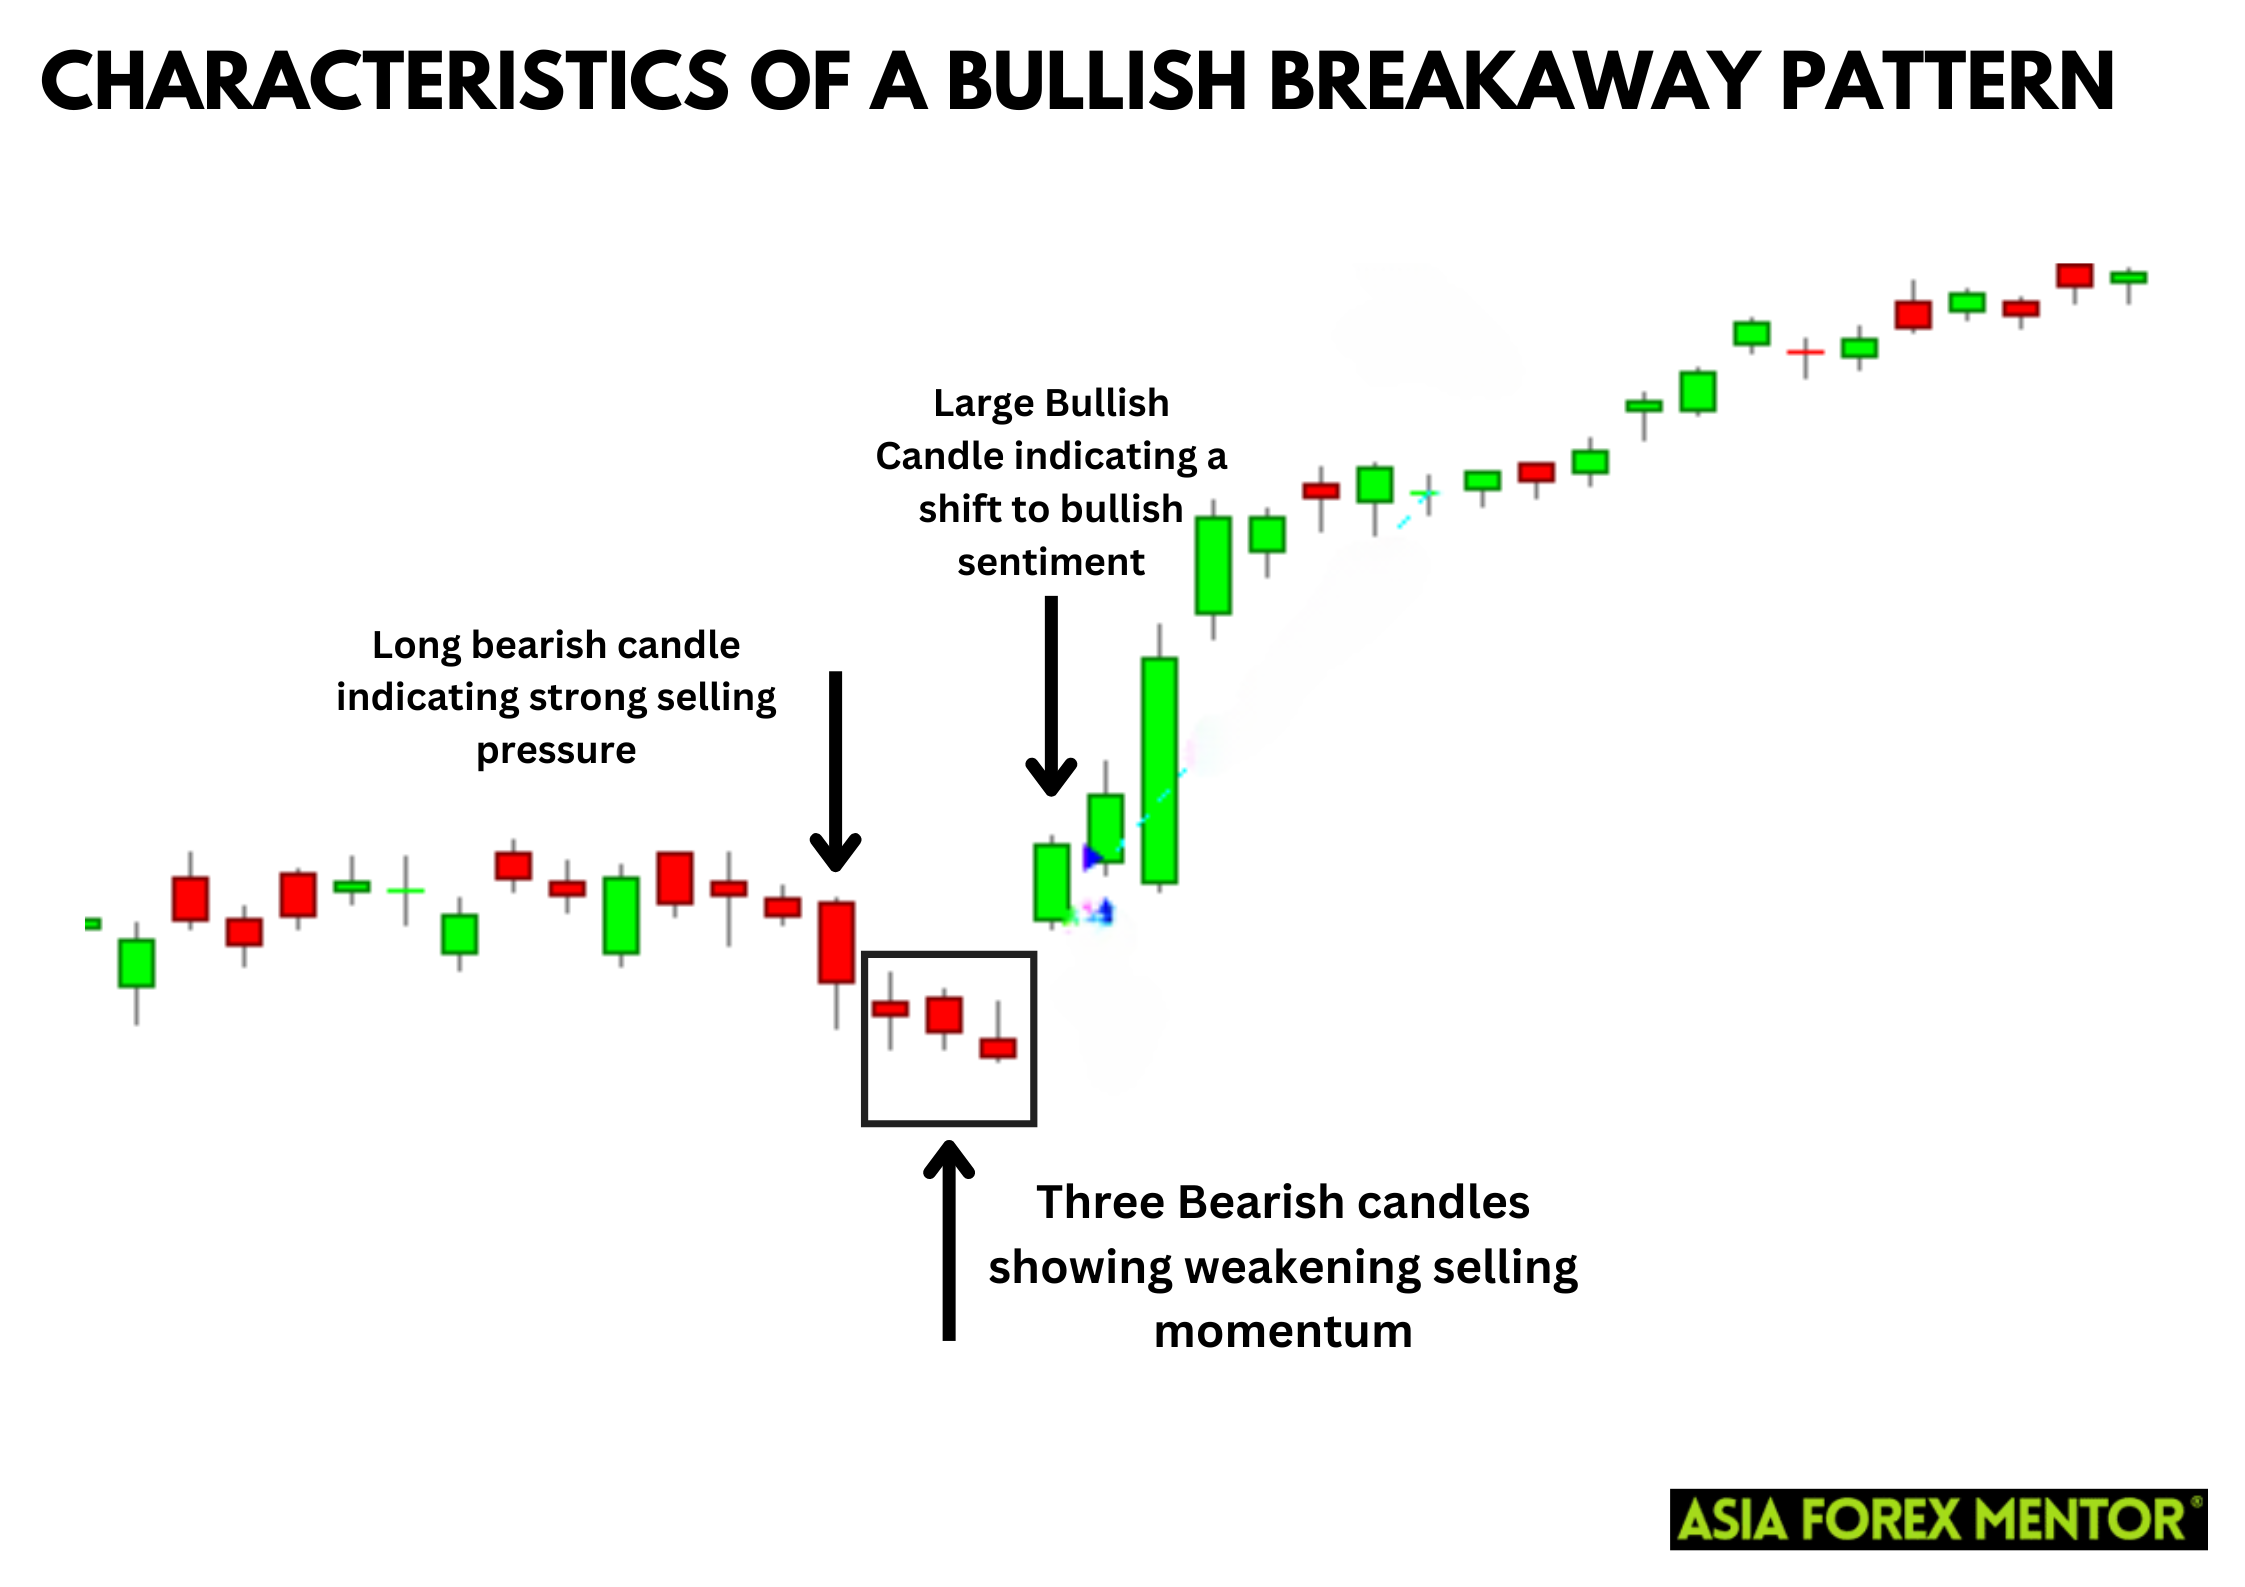
The bullish breakaway candlestick pattern is a five-candle formation that indicates a potential reversal from a bearish trend to a bullish trend. This pattern suggests that the market sentiment is shifting from bearish to bullish, signaling a possible end to the downward trend and the beginning of an upward trend.
Key Characteristics of the Bullish Breakaway Pattern
- First Candle: The first candle is a bearish long bar, indicating strong bearish sentiment and a continuation of the current downward trend.
- Second Candle: The second day’s candle is also bearish, reinforcing the bearish trend but showing less strength than the first candle.
- Third Candle: The third candle is a smaller bearish one, suggesting a weakening bearish sentiment.
- Fourth Candle: The fourth candle can be bullish or bearish but generally indicates indecision in the market.
- Fifth Candle: The final day, or the fifth bar, is a bullish long bar, indicating a strong reversal in market sentiment and the beginning of an upward trend.
The Formation and Interpretation of the Bullish Breakaway Pattern
Preceding Candles and the Breakaway
The pattern occurs after a significant downward trend, characterized by bearish sentiment and consistent lower closing prices. The first candle in the pattern usually reflects the lowest point of the bearish trend, a tall one with a long body and minimal shadows, indicating a strong bearish price swing.
The Transition Phase
The second, third, and fourth days show a gradual weakening of the bearish trend. The second day’s candle, while still bearish, is less intense. The third and fourth days display reduced bearish sentiment, sometimes with the fourth candle showing signs of market indecision, depicted by small bodies and two shadows.
The Bullish Reversal
The fifth candle is the most crucial in the bullish breakaway pattern. It marks a significant price gap from the previous candles, opening higher and closing even higher, indicating a strong bullish sentiment and suggesting a trend reversal. This bullish candle is typically a long bar, symbolizing a robust upward movement.
How to Trade the Bullish Breakaway Candlestick Pattern
Entry Point
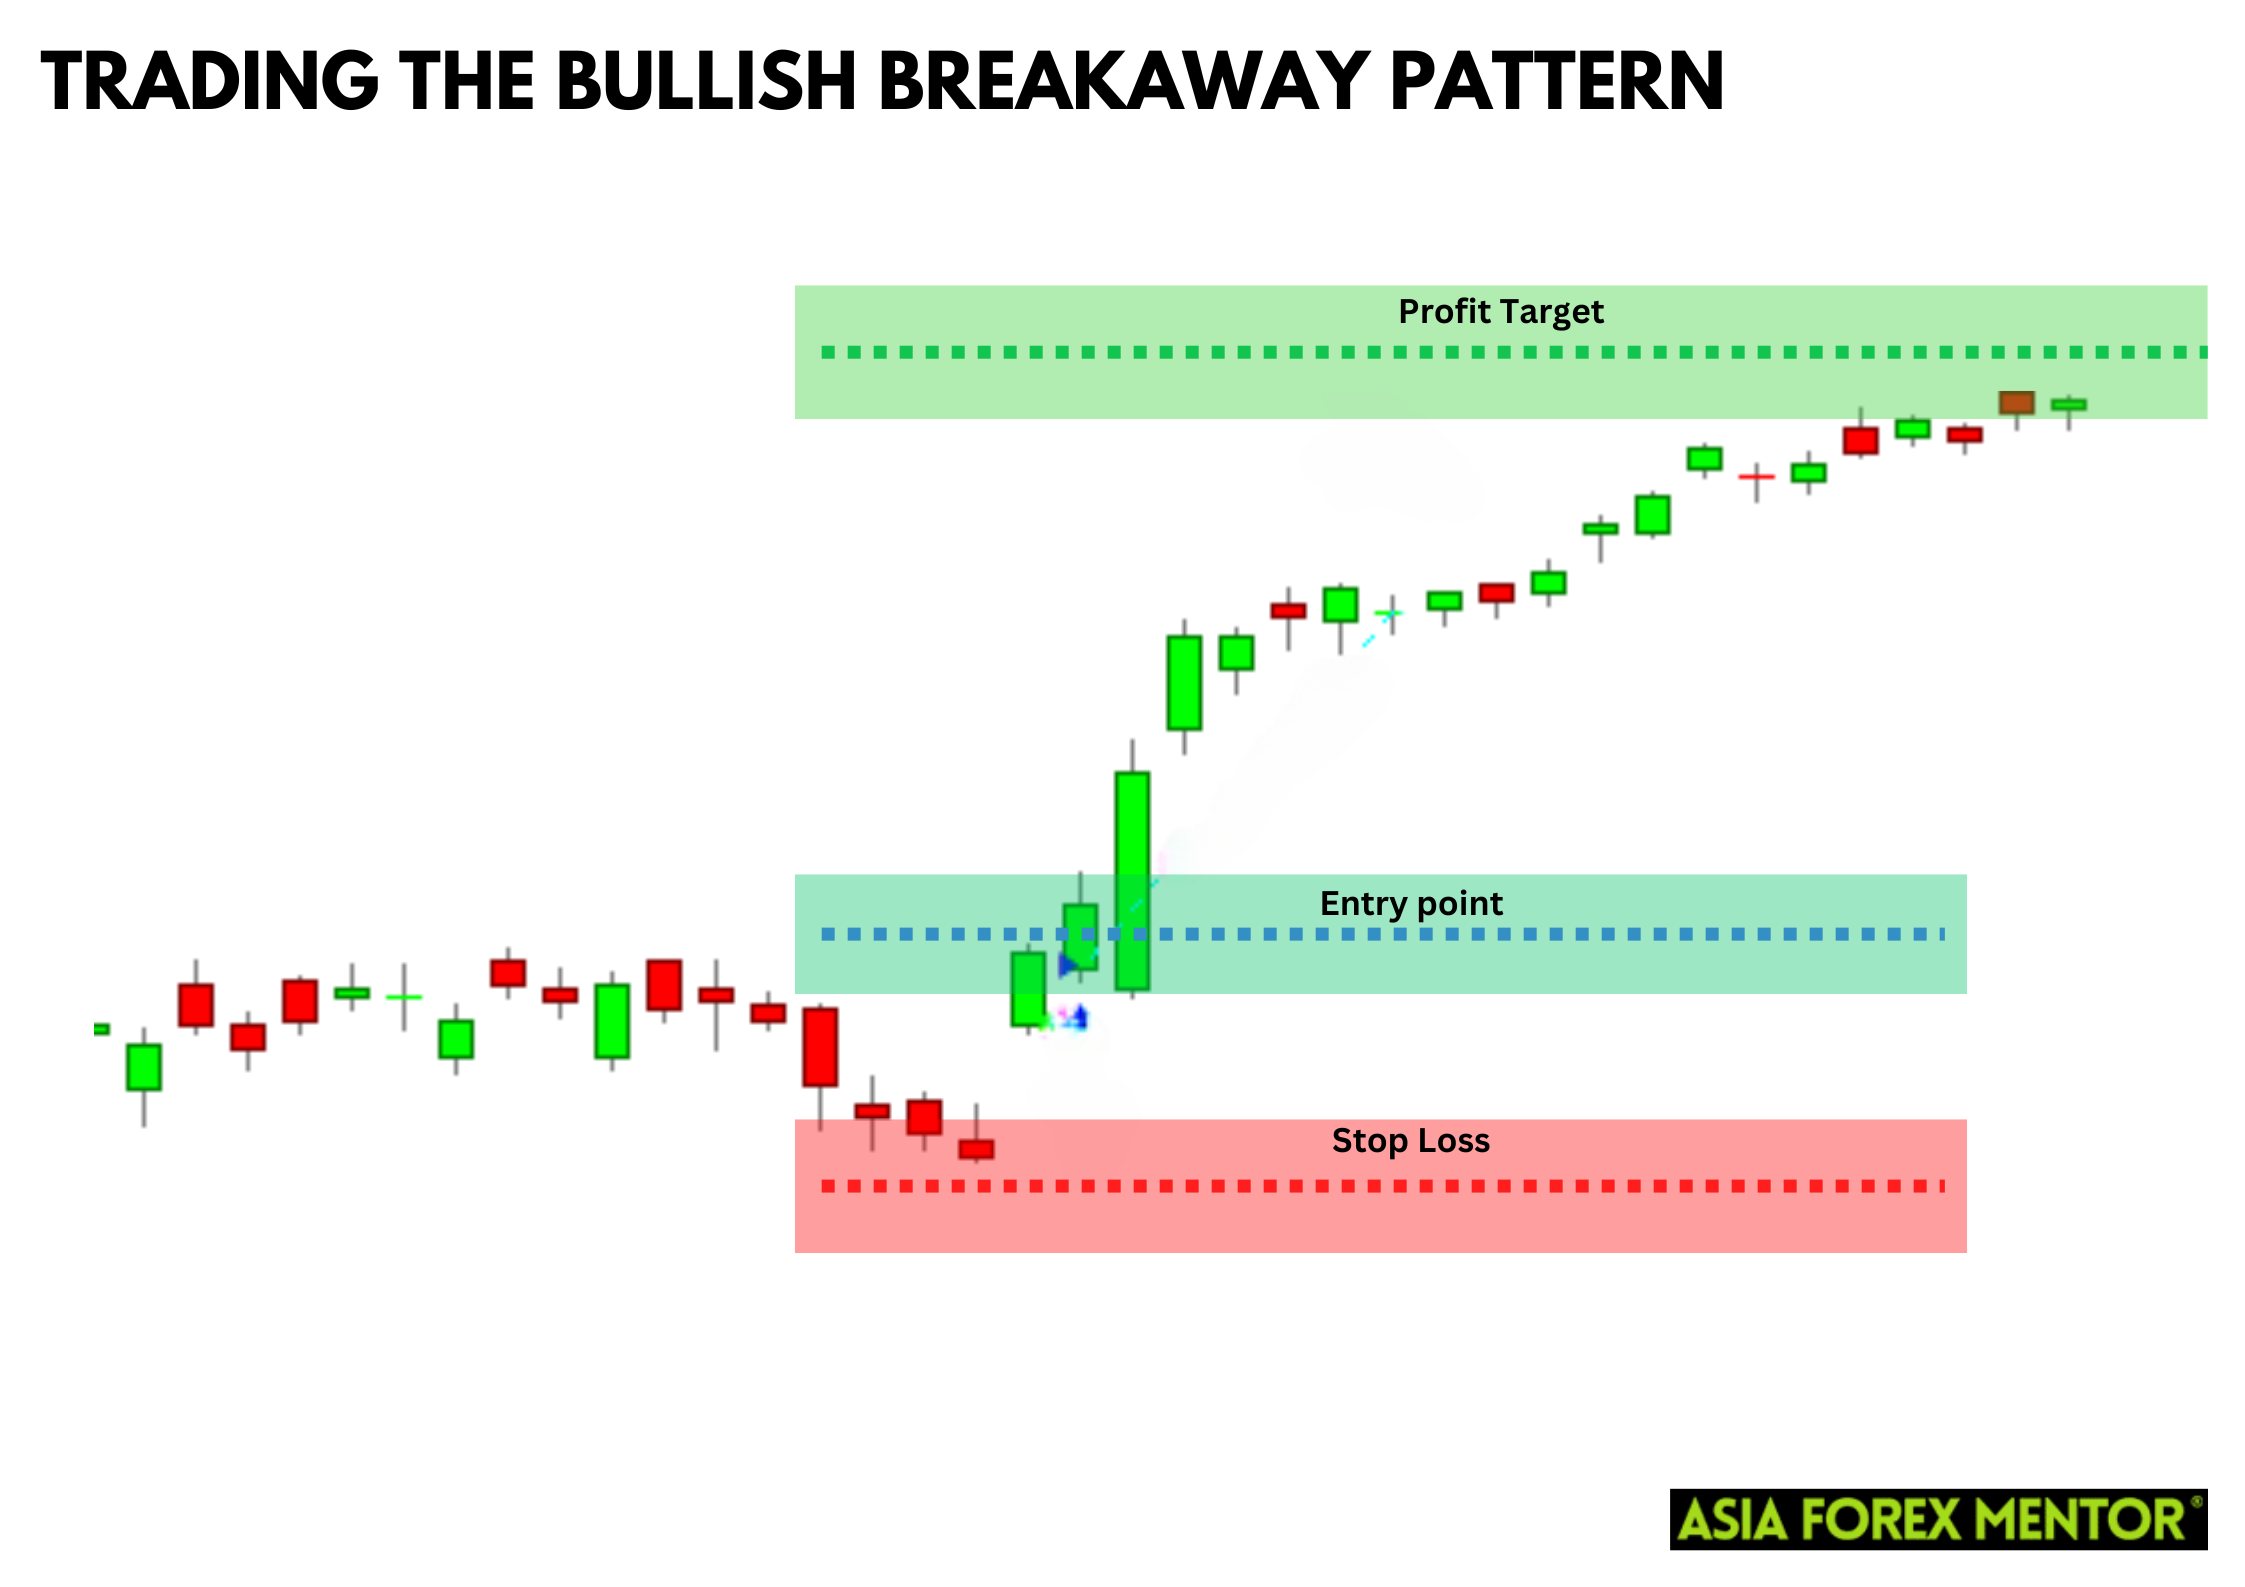
When trading the bullish breakaway candlestick pattern, the entry point is critical to maximizing potential gains. Traders typically enter a long position at the opening of the sixth trading day, following the confirmation of the bullish breakaway pattern on the fifth day. The confirmation comes from the strong bullish candle that marks a significant price gap and indicates a shift in market sentiment from bearish to bullish.
Stop Loss
To manage risks, setting a stop loss is essential. For the bullish breakaway pattern, the stop loss should be placed just below the low of the fourth or fifth candle. This placement ensures that if the market reverses and the bullish breakout fails, the loss is minimized. The low of the fourth candle often serves as a reliable level because it represents the lowest point of market indecision before the bullish reversal.
Target Profit
Determining a target profit involves analyzing the potential upward movement and setting realistic profit targets. One common approach is to measure the distance between the low of the first candle and the high of the fifth candle and then project that distance upward from the entry point. Alternatively, traders can use key resistance levels or historical price levels as target profit points. It’s also beneficial to consider using trailing stops to lock in profits as the price moves favorably.
Bearish Breakaway Candlestick Pattern
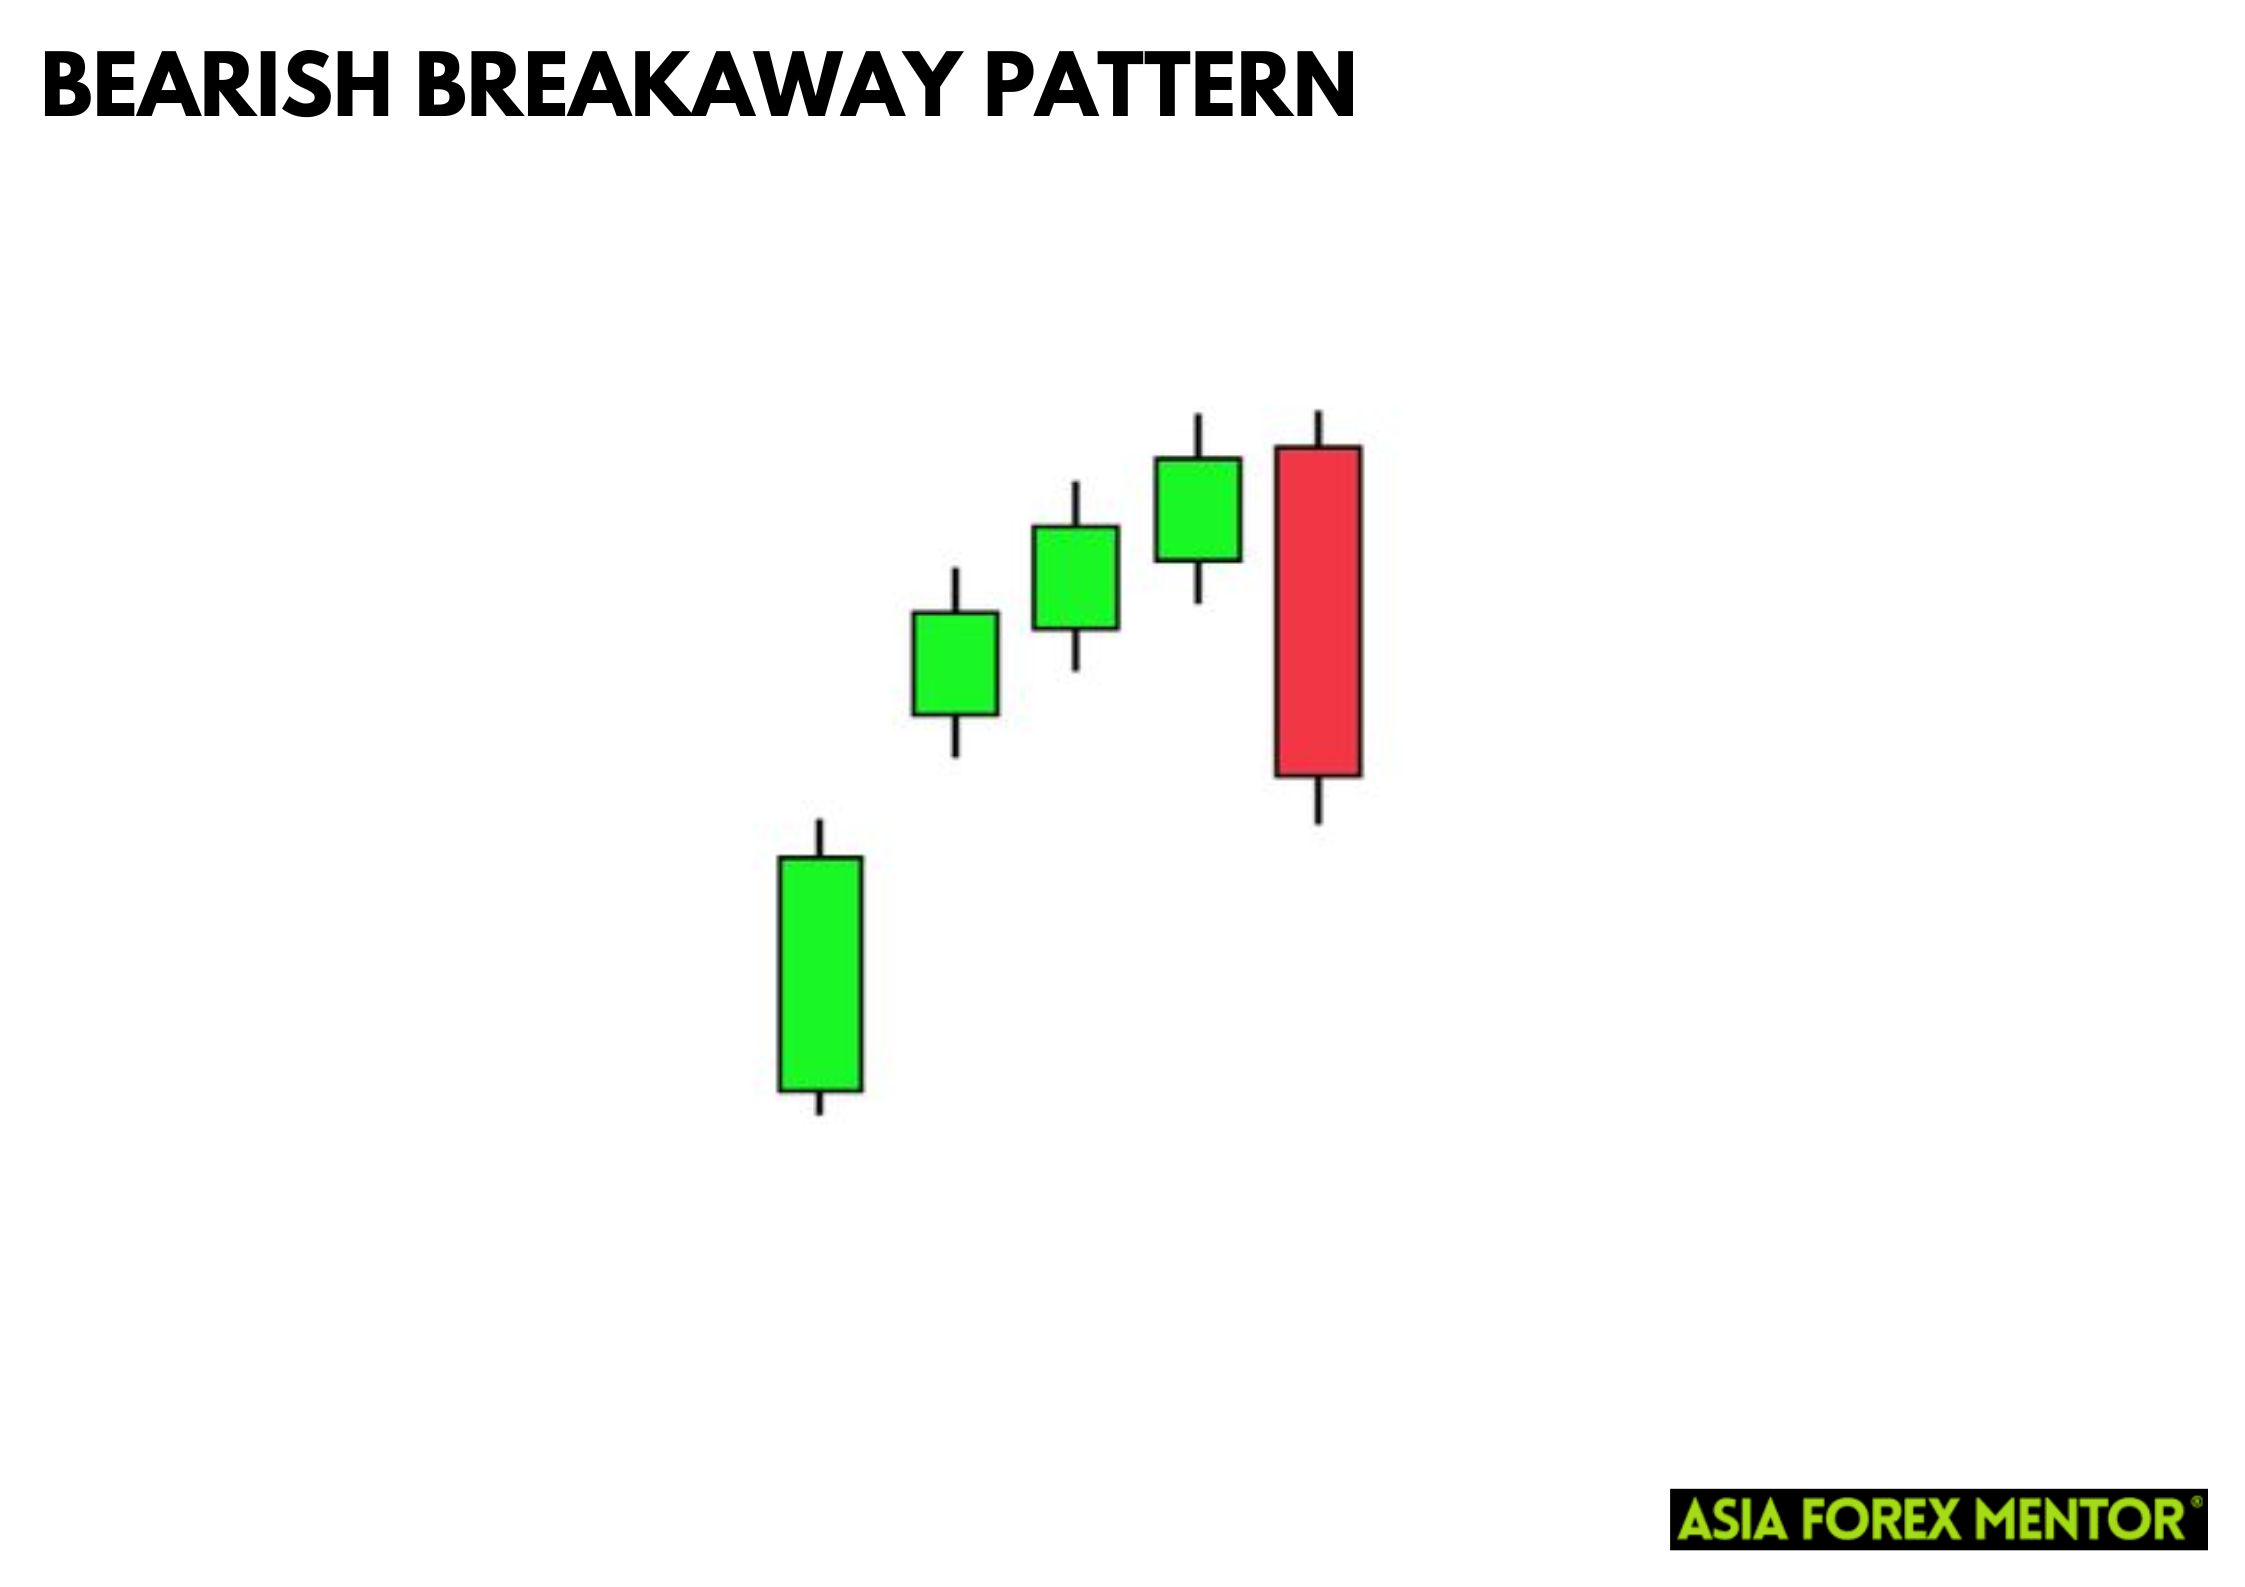
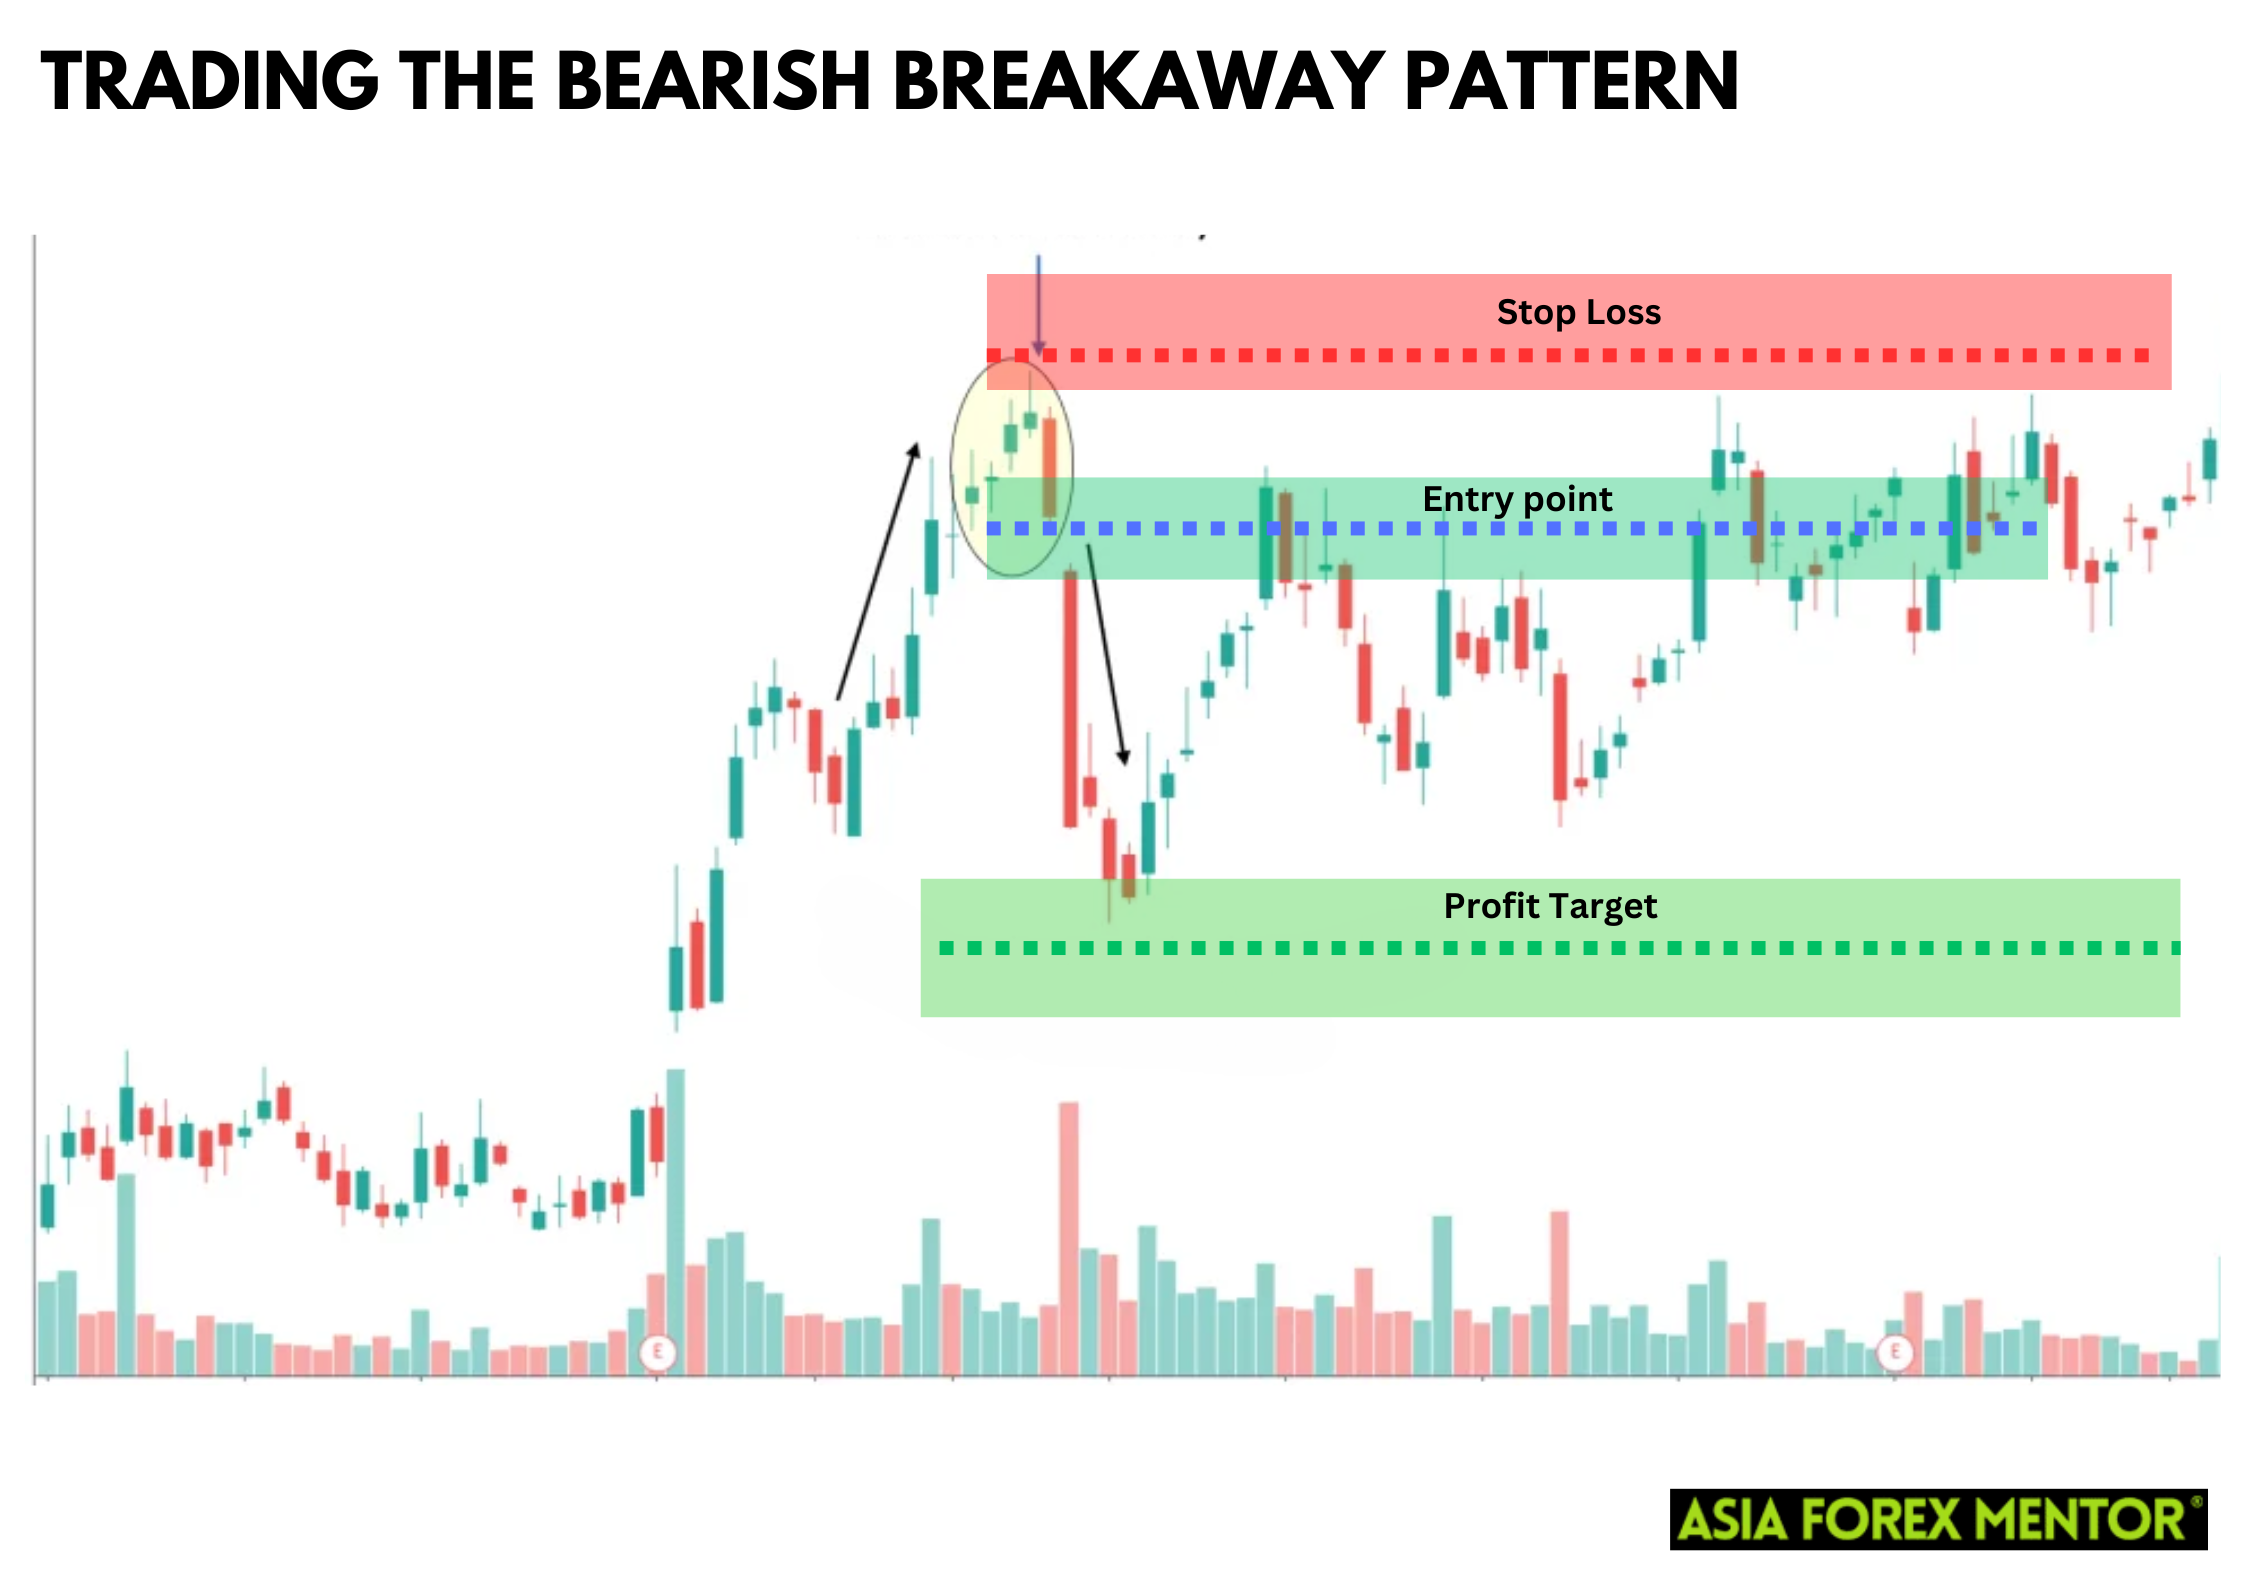
While the bullish breakaway candlestick pattern signals a reversal from a bearish trend to a bullish one, the bearish breakaway candlestick pattern indicates the opposite trend. The bearish breakaway pattern suggests a reversal from a bullish trend to a bearish trend.
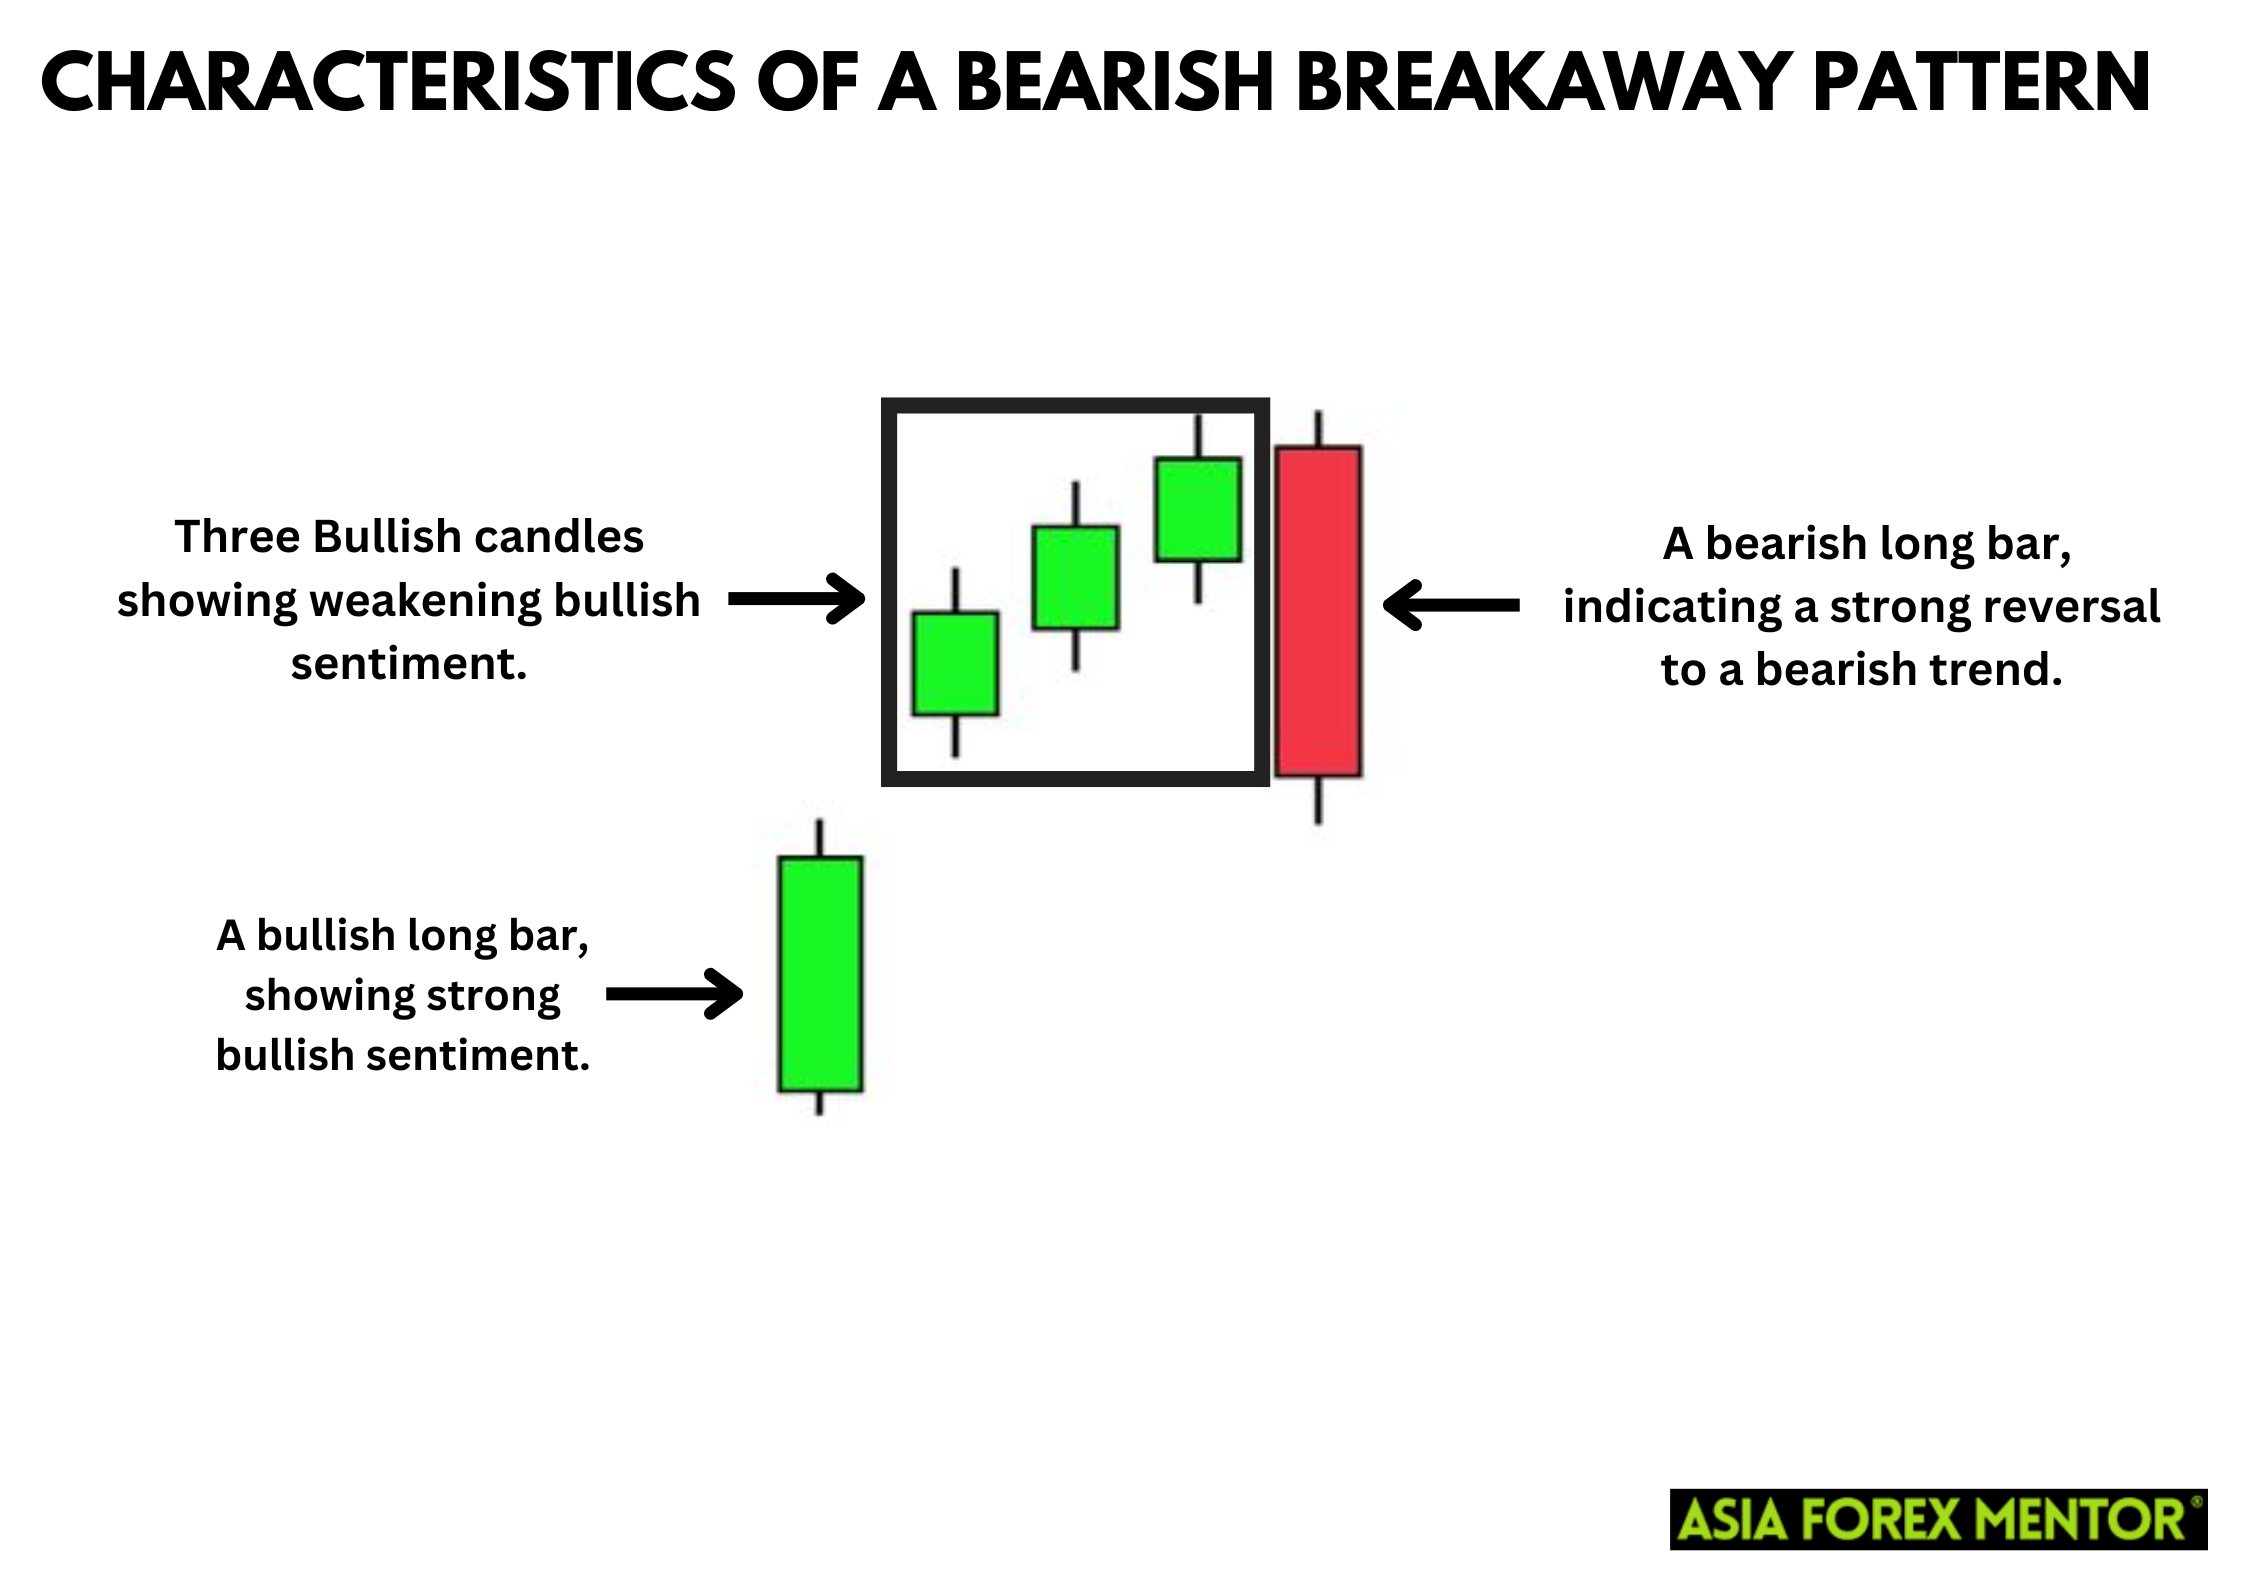
Characteristics of the Bearish Breakaway Pattern
- First Bar: A bullish long bar, showing strong bullish sentiment.
- Second Candle: Another bullish candle, but smaller than the first.
- Third Candle: A smaller bullish one, indicating weakening bullish sentiment.
- Fourth Candle: An indecisive candle, which can be bullish or bearish.
- Fifth Candle: A bearish long bar, indicating a strong reversal to a bearish trend.
Both patterns are significant indicators of trend reversals but in opposite directions. Understanding both is crucial for comprehensive technical analysis.
How to Trade the Bearish Breakaway Candlestick Pattern
Entry Point
The bearish breakaway candlestick pattern indicates a potential reversal from a bullish trend to a bearish trend. Identifying this pattern involves recognizing five key candles after an upward trend: a large bullish candle, a gap up, three smaller bullish or indecisive candles, and a large bearish candle. The optimal entry point for a short position is typically at the opening of the sixth trading day, following the confirmation of the pattern by the fifth bearish candle, which signals a strong shift in market sentiment from bullish to bearish.
Stop Loss
To manage risk when trading the bearish breakaway pattern, setting a stop loss is essential. The recommended position for the stop loss is just above the high of the fourth or fifth candle in the pattern. This placement helps limit potential losses if the market reverses and the bearish breakout does not sustain. By setting the stop loss above these candles, traders can protect themselves from significant upside risks.
Target Profit
Determining the target profit for the bearish breakaway pattern involves several strategies. One common approach is to measure the distance between the high of the first candle and the low of the fifth candle, then project this distance downwards from the entry point. Another method involves using key support levels or historical price levels as profit targets. Additionally, a standard risk-to-reward ratio of at least 1:2 is advisable to ensure that potential profits justify the risks taken. Utilizing trailing stops can also help lock in profits as the price moves favorably.
Importance of the Bullish Breakaway Candlestick Pattern in Trading Strategies
Identifying Trend Reversals
The bullish breakaway pattern is a powerful tool for identifying potential trend reversals. Recognizing this pattern early can help traders capitalize on the beginning of a new bullish trend, optimizing their entry points for long positions.
Enhancing Trading Strategies
Incorporating the bullish breakaway pattern into trading strategies can enhance decision-making processes. By confirming the pattern with other technical indicators, traders can develop robust strategies that consider multiple aspects of market behavior.
Managing Risks
Understanding candlestick patterns, including the bullish breakaway, allows traders to manage risks effectively. By identifying potential reversals, traders can set stop-loss orders and take-profit levels more accurately, minimizing losses and maximizing gains.
Conclusion
In conclusion, the bullish breakaway candlestick pattern is a vital indicator for traders and investors aiming to identify bullish reversals. By understanding its formation, characteristics, and significance, market participants can make more informed decisions. Moreover, recognizing the differences between bullish and bearish breakaway patterns enhances a trader’s ability to interpret market trends accurately.
Candlestick patterns, including the bullish breakaway, are indispensable tools in technical analysis. They provide insights into market sentiment, trend direction, and potential reversals, forming the foundation for effective trading strategies and investment decisions.
Also Read: All You Need to Know About the Concealing Baby Swallow Pattern
FAQs
What is the bullish breakaway candlestick pattern?
The bullish breakaway candlestick pattern is a five-candle formation indicating a potential reversal from a bearish trend to a bullish trend. It consists of a series of candles that show a weakening bearish sentiment, culminating in a strong bullish candle.
How does the bullish breakaway pattern differ from the bearish breakaway pattern?
The bullish breakaway pattern signals a reversal from a bearish trend to a bullish trend, while the bearish breakaway pattern indicates a reversal from a bullish trend to a bearish trend. Both patterns involve five candles but in opposite directions.
Why is the bullish breakaway candlestick pattern important in trading?
The bullish breakaway candlestick pattern is important because it helps traders identify potential trend reversals early, allowing them to capitalize on new bullish trends. Incorporating this pattern into trading strategies can enhance decision-making and risk management.

