Best Technical Indicators for Day Trading
Understanding the best technical indicators for day trading is useful for those interested in share trading, forex trading, and commodities trading. This is thanks to the special nature of day trading. Here, traders seek to buy and sell stock in one day and profit using the volatile stock indices.
As expected, this exposes traders to more risk. In turn, traders must understand the market comprehensively to avoid losses. This is where the best technical indicators for swing trading becomes relevant. It ensures traders can better understand the market and maximize their returns.
Content
- Information That Technical Indicators Offer
- Best Technical Indicators for Day Trading
- Finding the Best Indicator for Intraday Trading
- Best Combination of Technical Indicators
- Improving Technical Indicators
- In Conclusion
- Frequently Asked Questions
Information That Technical Indicators Offer

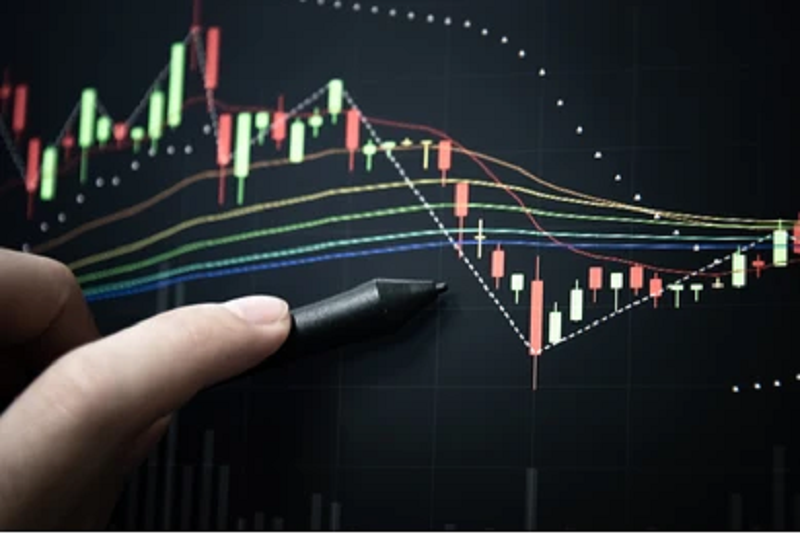
Technical indicators refer to mathematical calculations plotted by traders on price charts. They are usually plotted as lines and help traders identify specific trends and signals within the trading market. It is relevant to a wide range of trading such as forex, commodities, and share trading.
Technical indicators offer valuable information and pointers that enable a trader to assess existing market conditions. In turn, traders can make improved decisions regarding their trade positions. The information offered include:
- The trend’s direction to determine its movement
- The profit potential of trade due to its volatility
- The presence or lack of momentum inside the investment market
- Identify popularity using volume measurements
![]()
Best Technical Indicators for Day Trading
There are various technical indicators relevant to day trading. However, some technical indicators are more accurate than others. Here are some of the best indicators for day trading 2020.
1. Moving Averages
Regarded as the daily moving averages (DMA), this is the most used technical indicator for day trading. The moving average represents a line on the stock chart. This line then connects the average closing rates for a period.
Typically, where the duration of stock movement is longer, it correlates to a reliable moving average. This indicator bases its application on the fact that stock prices remain volatile. In turn, it helps traders understand the movement of stock price, more so as their direction is not one-dimensional.
2. Bollinger Bands
This is generally regarded as an advancement or improvement to the moving average. Under this method, three different lines are established on the stock chart over a certain period. These are a lower limit, an upper limit, and the average closing rates.
Note that these bands depict the standard deviation of the stock. That is, the price’s degree of decrease or increase from the average. This indicator allows traders to understand the trading range of stocks.
3. Momentum Oscillators
This is one of the best indicators for day trading forex. It takes into recognition the volatility of the stock market. That is, it recognizes that prices of stocks are constantly changing—increasing and decreasing. In turn, it caters for instances where there is a short-period cycle in the stock market regardless of the fact that the stock market is neither bullish nor bearish.
Traders usually miss this situation. However, this indicator for intraday trading ensures traders can identify the scenario above. It also ensures that they are well aware of any modification of market sentiments.
Momentum Oscillators fall within a range of 0 and 100. It becomes advantageous once the price has achieved a new low or high, and traders want to identify the possibility of a further fall or rise.
4. Relative Strength Index (RSI)
This indicator is useful to traders to compare the losses and gains of a share price. Usually, the information realized is tabulated into an index format, and the RSI score stands between 0 and 100. Various analysts recommend the buy option once the RSI attains 70 and the sell option once it drops to 30.
However, this pattern is not universal to all stock options. In turn, careful and advance research is relevant when utilizing this technical indicator for day trading.
5. Moving Average Convergence Divergence (MACD)
Moving Average Convergence Divergence is considered as part of the best indicators for day trading options by momentum traders. This indicator offers information on duration, momentum, and trend direction. It is based on the divergence and convergence of 2 moving averages. In turn, a negative value and a positive value indicate a negative and upward trend, respectively.
Finding the Best Indicator for Intraday Trading
To determine the best indicator for intraday trading, traders can test out some of these indicators. Usually, traders can do it singularly and then in combination with others. Consequently, traders can end up with a few options or switch off, all depending on the traded assets.
Regardless, it vital that things are kept simple with technical indicators. So, considering a pair of indicators to determine your entry and exit point is desirable. It is also best to utilize only one technical indicator from each category to avoid distracting and unnecessary repetition.

Best Combination of Technical Indicators
Traders can pair up-sets of technical indicators on the chart to enable them to identify the best time to begin and exit a trade. For instance, traders can combine MACD and RSI to identify and strengthen a specific trading signal. In this instance, the RSI can indicate oversold or overbought conditions by estimating an asset’s price momentum. Then, the MACD becomes relevant to the underlying price trends.
Regardless, when choosing pairs, traders should opt for one indicator that’s considered a lagging indicator and pair with another indicator that’s considered a leading indicator. This is because leading indicators provide signals before the basis for making a trade has become known. On the other hand, lagging indicators provide signals following the emergence of those conditions. This way, they function as authentication of leading indicators. Precisely, traders are less likely to trade on false signals as their underlying conditions are confirmed.
It is also necessary for traders to choose a pairing that contains indicators from two of the available types. Choosing two similar types should be avoided. So, traders must choose two of momentum, trend, volume, and volatility.
Examples of momentum and trend are the RSI and MACD, respectively. Volatility, as suggested by the name, functions based on an asset’s price volatility. Volume indicators then function based on an asset’s trading volume.
This recommendation is relevant to ensure traders can obtain a wide range of information to base their trading strategy. Using the same type will mean the same information is obtained. However, with different types, traders enjoy multiple perspectives to a trading decision.
The use of multiple indicators is also a valuable means of reinforcing trading signals. This is because they provide access to more information and based on different metrics. For instance, traders can opt for two lagging and two leading indicators of a different type. This will significantly improve the chances of identifying false signals and creating a more solid trading strategy.
Improving Technical Indicators
Regardless of the choice of technical indicators, traders must analyze these indicators and determine their effectiveness. In turn, traders must determine the drawbacks of an indicator, the likelihood of false signals, and the likelihood of failing to signal entirely. Finally, traders must also consider the timing of the signal—whether it signals very late or too early.
A combination of these considerations will ensure that traders can improve on the use of technical indicators. For instance, a technical indicator might be more effective for forex and less effective when trading stocks. In turn, it is only natural that traders prioritize these considerations to ensure they achieve success during day trading.

In Conclusion
Understanding the relevance of technical indicators is necessary to maximize profit during day trading. These indicators provide relevant information that traders can base their trading strategy on. To fully maximize these indicators, traders must recognize the best technical indicators for day trading.
Overall, these technical indicators are best used in pairs. Then, when choosing pairs, ensure they consist of technical indicators that are lagging indicators such as MACD and those regarded as leading indicators such as RSI. We also advise that traders analyze these indicators and their effectiveness. This way, traders can maximize profits during day trading.
Frequently Asked Questions
1. What is the most accurate intraday trading indicator?
There is no consensus among traders about the most accurate intraday trading indicators . However, regardless of the varying opinions, the popular choice is the Relative Strength Index (RSI).
However, note the even the best combination of technical indicators isn’t a trading strategy alone. Instead, it ensures traders can identify an existing trend which is then used to develop a strategy. This is why we advise the use of multiple indicators as the basis of a trading strategy.
2. What is the indicator preferred by professional traders?
Technical indicators are maximized with general market knowledge by professional traders to establish an effective trading strategy. The options preferred by most professional traders to obtain essential price information and trade signals are:
- Moving Average Line
- On-Balance-Volume (OBV)
- Relative Strength Index (RSI)
- Moving Average Convergence Divergence (MACD)
3. How can I use the Supertrend indicator during intraday trading?
Various charting software remains effective in generating Supertrend indicators. However, we advise that traders open it for the relevant stock to be followed, indicating a 10-minute time frame. Traders can then track selling or buying signals in conjunction with any of the best technical indicators for day trading.


