
Best Forex Strategy For Consistent Profits
The secret behind every successful forex trader is their trading strategy. There is a multitude of trading strategies. But the winning strategy is the one that makes profits consistently most of the time it is applied (Best Forex Strategy for Consistent Profits). A trader first looks for the best forex trading strategy that suits their trading personality. Once they find the strategy they repeatedly test until they are satisfied, the results will be consistent and reliable. The trading strategy should be consistent in making winning trades and reliable to perform in various market conditions.
The trading strategy as a whole is a combination of technical tools and indicators with effective money management. The core of the technical strategy is the indicator. We will discuss different technical trading strategies that are considered reliable and are followed by most traders. These strategies work in almost every market condition and provide the trader with great flexibility.
Most successful traders accept that there is no single trading strategy that can make profits every time they trade. But they accept and understand that a reasonable win rate is enough to make good profits in the forex market.
Contents
- What is the most accurate forex strategy?
- EMA cross over – very easy and profitable trading strategy mt4:
- Moving Average Convergence and Divergence – MACD the most accurate forex strategy:
- Bollinger bands a simple profitable forex trading strategy:
- Support and Resistance trading the best forex strategy ever:
- Conclusion:
What is the most accurate forex strategy?
Successful traders have an additional element to a trading strategy than others. It is the top-down approach. Traders look at a big picture or a more significant trend first. In terms of technical analysis, this top down approach refers to the higher time frames. Success full traders analyze the higher time frame charts first. Once they identify a trend in the higher time frame charts, then they prepare their mindset to trade in that direction. Suppose a trader identifies the trend direction as bullish in the higher time frame. In that case, they will place BUY trades only and stay in that direction until the end of that trend.
However, to find the best entry point and exit point accurately, they will use the shorter time frame chart. The trade will be placed in the shorter time frame charts in the direction of the trend identified in the higher time frame charts. The entry and exit using the smaller time frame charts enable the trader to find precise entries and exits within the bigger time frame direction. Successful traders never place a trade counter to the identified trade, no matter how good the counter trader opportunity.
The trader trades a higher timeframe chart and will benefit from the bigger trend moves. However, the signals are from a smaller timeframe with much tighter stop losses.
The following trading strategies can be traded with a top-down approach. The following strategies are already widely accepted and followed by traders as successful trading strategies. The results of these strategies can be enhanced further using the top-down approach.
EMA cross over.
MACD.
EMA cross over – very easy and profitable trading strategy mt4:
The EMA cross is a very easy and profitable trading strategy mt4. Most traders use Moving averages because of their simplicity and accuracy. The EMA – Exponential Moving Average responds more quickly and reduces the lag associated with moving averages. The EMA gives more weight to the latest price movements and is considered a reliable indicator.
A standard moving average crossover strategy uses two moving averages, a fast-moving average, and a slow-moving average. Suppose the fast moving average crosses over the slow moving average to the upside. In that case, it indicates an uptrend, and if the crossover is towards downwards, we anticipate a downtrend.
In the following charts, let’s see the methods to apply the top-down approach to identify the best entry and exit points.
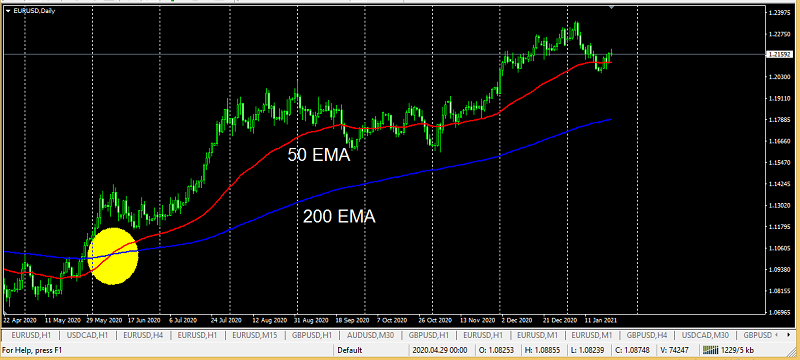
The above Daily EURUSD chart is from 22.04.2020 till 22.01.2022. The 200 EMA ( Blue line ) crosses the 50 EMA ( Redline ) upwards on 11.06.2020, indicating the upcoming uptrend. The trader once identifies the EMA Bullish crossover, then decides to place only BUY trades to enter the trend and continue to stay in this direction.
The trader now looks for a more precise entry using the lower time frame chart. With entries only in the Bullish direction and ignores any trades to the downside, In other words, the trader from now onwards will place all BUY signals in a lower time frame charts and ignores all SELL signals.
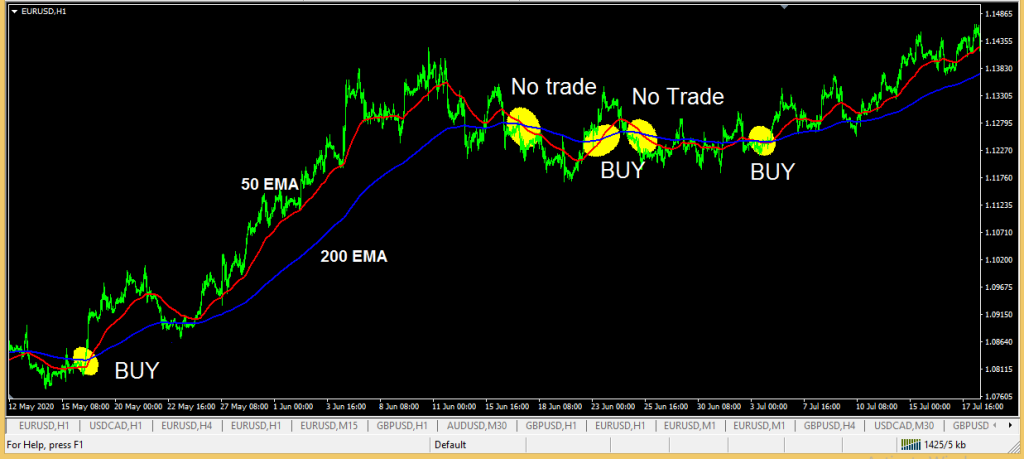
The above chart shows an H1 chart of EURUSD from 12th May 2020 to 17 July 2020, a part of the EURUSD D1 chart. Placing only the BUY trades will help the trader to make substantial profits.
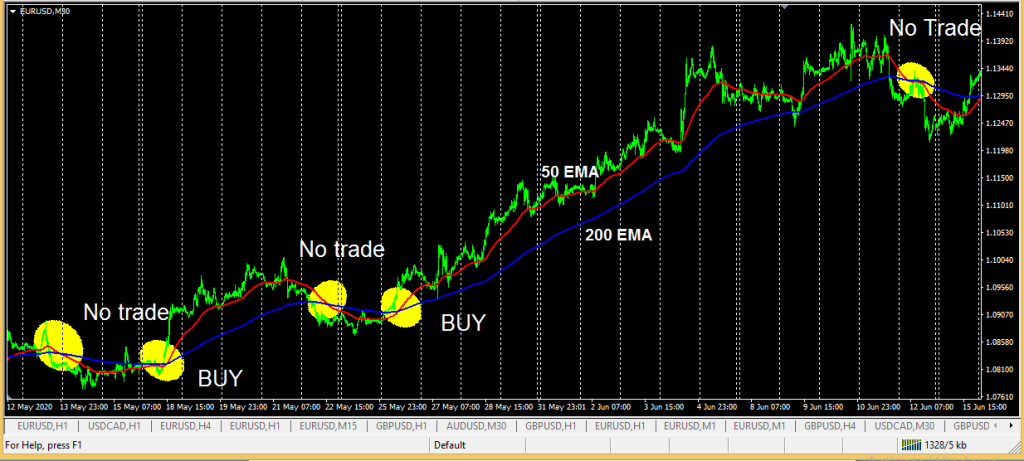
The above chart shows a EURUSD M30 chart from 12th May 2020 to 15th June 2020, a small area of the EURUSD D1 chart. The trader can go as low as the M30 chart to identify precise entry points to follow the more significant trend from the D1 chart. Again the trader ignores all SELL signals and will only consider the BUY signals.
It is important to note that many traders use lower timeframe charts as M15, but lower timeframe charts may provide whipsaws.
Moving Average Convergence and Divergence – MACD the most accurate forex strategy:
MACD can be traded in a few different methods. The MACD crossover of the ZERO line, the MACD signal line, and convergence and divergence. No matter the trading method, MACD is considered very reliable by many traders, and MACD forms a part of many automated trading systems.
However, we will use the Top-down approach to identify the entry and exit points to make successful trading using some examples.
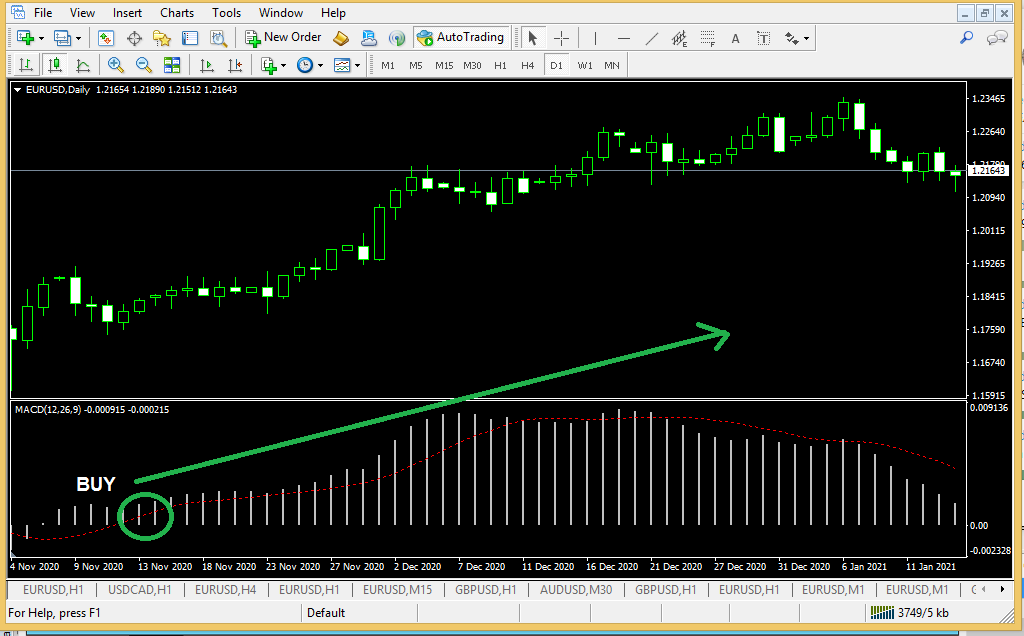
The above chart is a EURUSD D1 from 04 November 2020 to 11th Jan 2021. The MACD went above the Zero line, with the signal line also crossing over, signaling a bullish trend and warranting a BUY. The trader would now decide to be bullish and will take any only BUY positions.
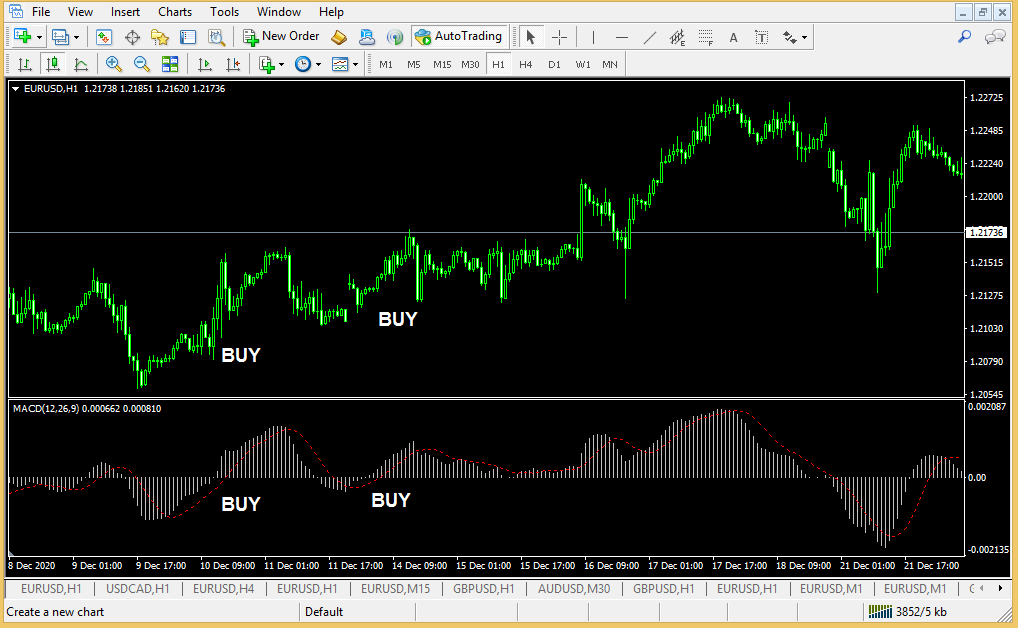
The above EURUSD H1 chart 8th Dec 2020 to 21st Dec 2020 shown here is a part of the EURUSD D1 chart. The trader would ignore all the sell signals of the MACD and will only trade the BUY signals, as the higher timeframe chart shows a BUY trend. It can be easily noticed that the BUY trades would have been very successful for the trader. The BUY opportunity on 11th Dec and 14th Dec would have been profitable, with the signal on 14th Dec proving to be quite a successful one.
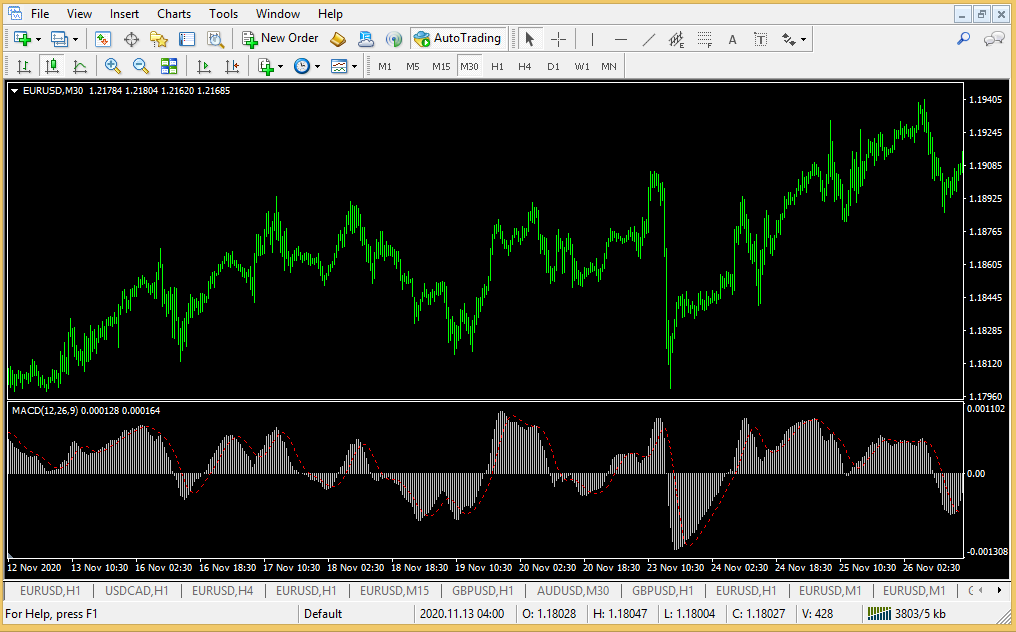
The above MACD M30 chart is also within the EURUSD D1 range. The chart also shows multiple trading opportunities to the BUY side. The trader could ignore the SELL signals and only focus on trading the BUY signals and be very profitable. The trades also have a greater risk and reward ratio since they are placed in line with the higher time frame trend direction.
Bollinger bands a simple profitable forex trading strategy:
Bollinger Bands is an excellent indicator for trend following. Many trend traders use them to identify the trend direction and the market volatility using the bands. The bands’ direction provides direction and entry points, but the bands’ contraction signals an impending market move. The widening of the bands implies volatility, while the ranging markets are associated with narrower bands. The outer bands act as support and Resistance and also to identify targets for an exit . The trading results using Bollinger bands can yield higher results if combined with the Top-Down approach.
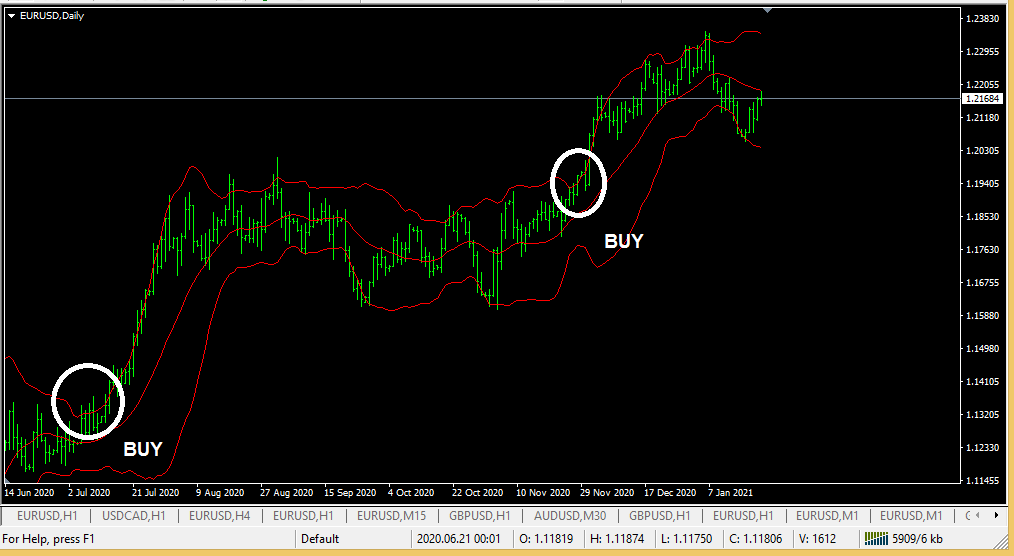
The above EURUSD D1 candlestick mt4 chart shows the prices from 14h June 2020 to 7th Jan 2021. The chart clearly shows the prices breaking through Bollinger’s upper band, indicating an uptrend on 3rd July and 29th November 2020. Both these dates signaled a BUY in a daily chart. The trader can use this signal to place a trade using this same chart. But the trade can also use a lower timeframe chart to identify specific and best entry points further.
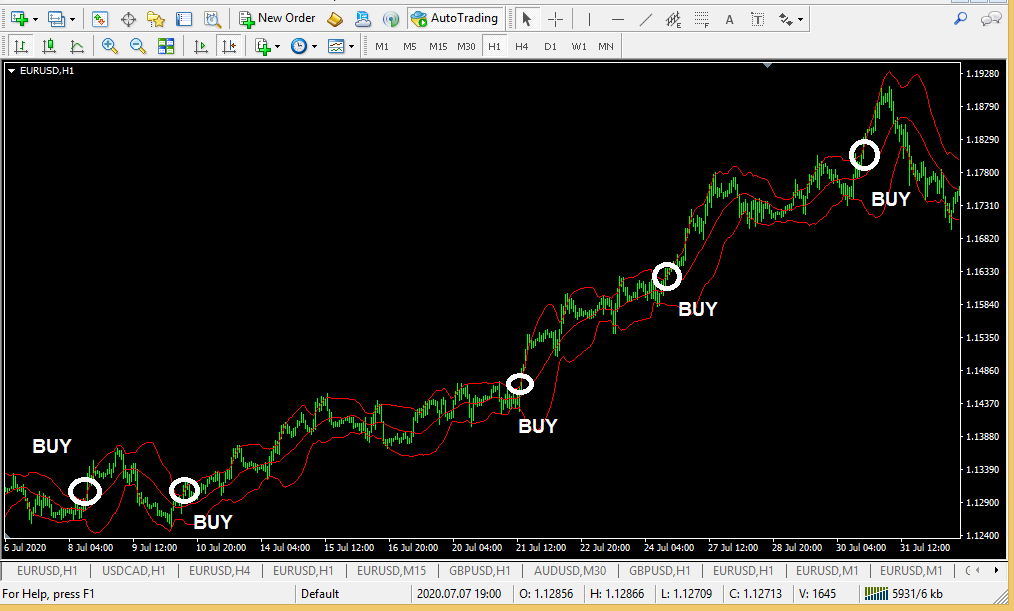
The above EURUSD H1 chart displays from 8th July 2020 to 31st July 2020, a part of the EURUSD D1 chart. Keeping in mind the BUY signal from the D1 chart, the trader will decide to choose only those BUY signals from the H1 chart while ignoring other signals. Thereby the trader stays within the bigger trend direction while having accurate entry and exit points with lower drawdown. The above chart also displays multiple trading opportunities with all of the trades resulting in positive outcomes.
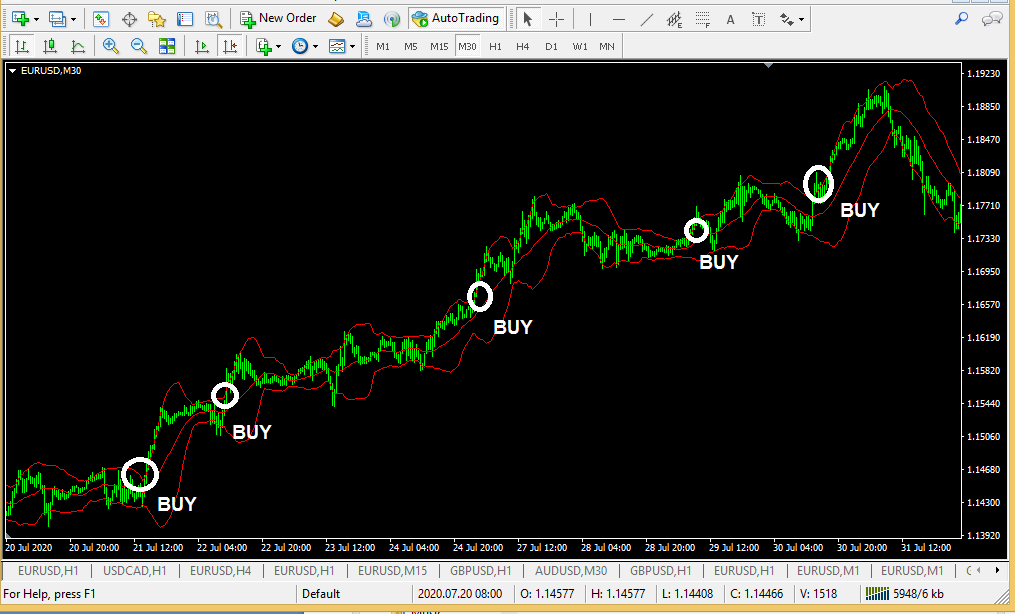
However, if the trader decides to day trade, the trader can use the above M30 charts to day trade with smaller stop loss and profits. But the directional bias will remain according to the higher timeframe chart. In this case, the trader decides to place only BUY orders and can day trade successfully. The above M30 EURUSD chart from 21 July 2020 to 31 July 2020, the EURUSD D1 chart provides multiple trading opportunities with positive outcomes.
Support and Resistance trading the best forex strategy ever:
Support and Resistance are considered as the primary stepping stone of all technical tools and indicators. The Support and Resistance can be either horizontal lines or an angled line as a trend line and provide vital clues for any technical trader. Almost every trader uses Support and Resistance and measures nearly any price regarding the nearest Support or Resistance. The proximity of the price near Support or resistance lines invokes trading decisions. There may not be a trader who discusses weak Support, strong Support, weak or strong Resistance in their day to day trading.
It’s a tradition to start the trading day by looking at a higher time frame chart to identify the support and Resistance. Traders who already in a trading position refer to the next higher time frame chart to identify the next resistance or support level. Because Support and Resistance in the higher time frame charts are considered very strong, a breakout or rejection of the support or Resistance in higher timeframe charts would provide higher returns.
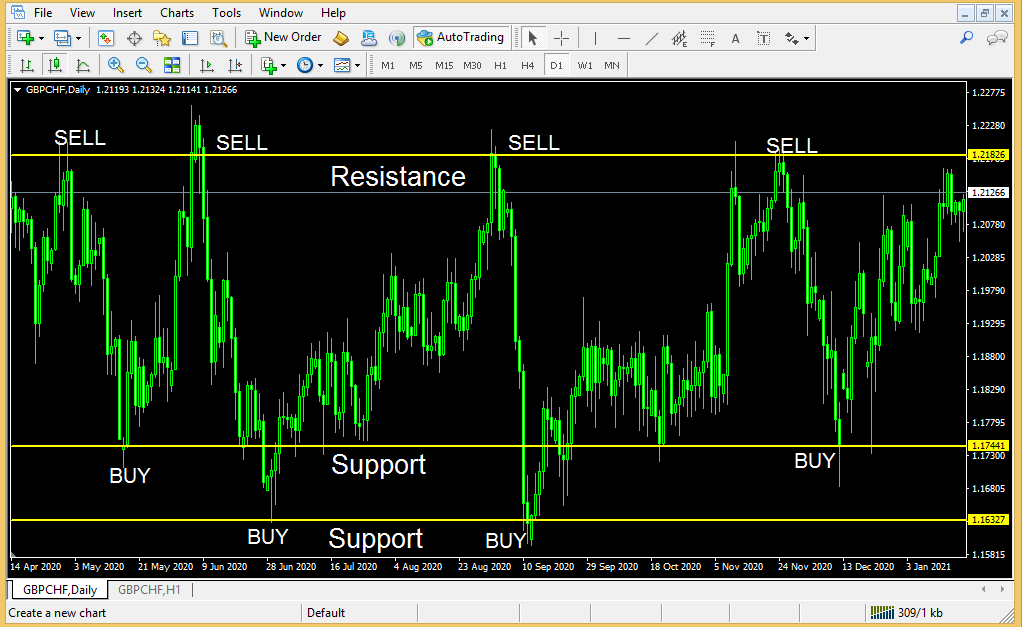
In the above GBPCHF Daily chart from 14th April 2020 to Jan 10th 2021 the prices were in range moving between support and Resistance. The 1.2182 levels provided strong Resistance, while the 1.1744 and 1.1632 levels provided the necessary Support, respectively. Once the trader identifies the support and Resistance in the Daily timeframe. The trader can use a lower time frame chart to analyse closely and find a best entry point using H1 chart or M30 charts.
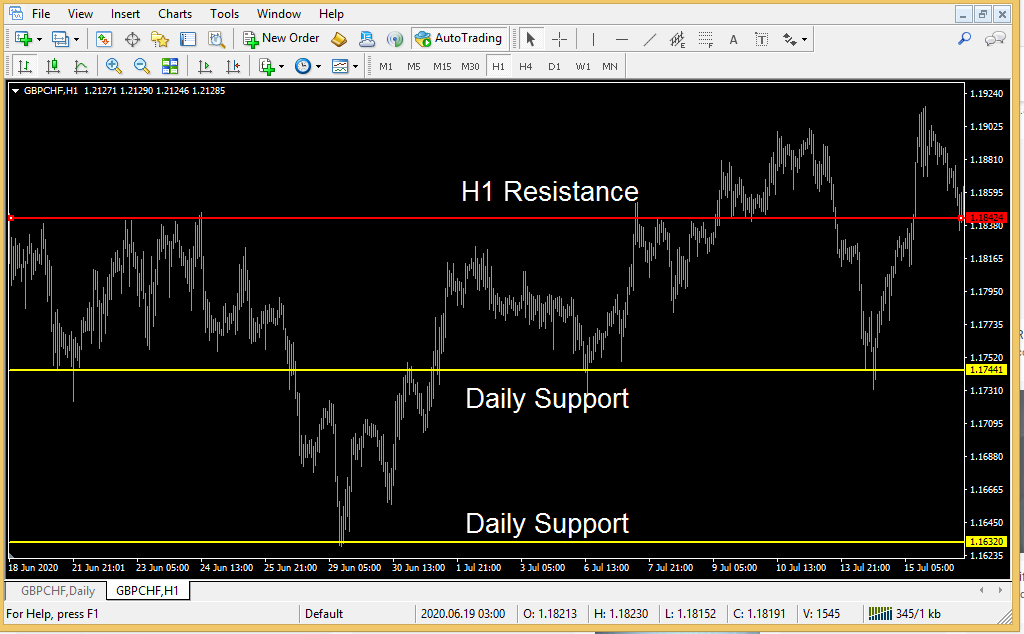
The above GBPCHF chart H1 chart shows the data from 18th June 2020 to 18th July 2020. The Support and Resistance from the daily chart are marked as yellow. Its is very clear to see the price action at these levels in the H1 chart where prices respect the daily Support levels and react. The H1 chart identifies additional Resistance at 1.1842 . A trader using the H1 chart can react at the Daily Support levels as these levels are already known. So the trader anticipates the market reaction and confirms the entry positions further by the price action.
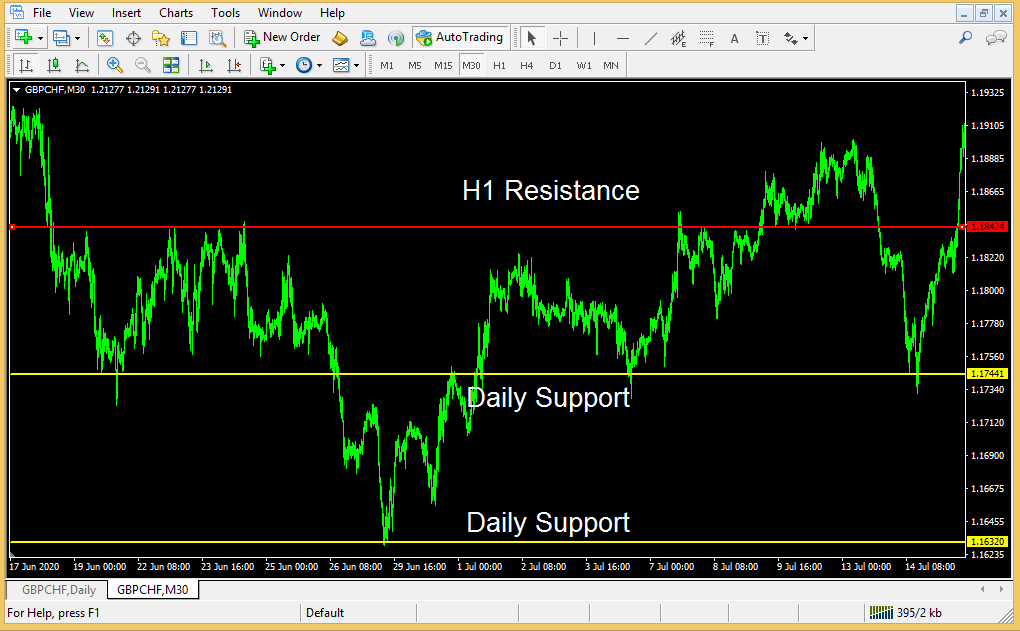
The above GBPCHF M30 chart from 18th Jun 2020 to 18th July 2020 , further clarifies the market reaction around the established daily support levels and also adds more clarity to the H1 Resistance. The trader can further understand the price action and confirm the entry points using the M30 charts.
The best strategy to work with Support and Resistance successfully is the use of the Top-down approach. It is highly productive and would provide a trader with an edge. If the trader would mark the Support and Resistance of a higher time frame chart and then narrow it down to the lowest possible chart to identify the entry and exit points.
Conclusion:
The above four trading strategies are tested by many traders and are trusted by successful traders. The indicators are very result-oriented and can perform as a standalone system. They are robust in any market conditions. The basis for anticipating and identifying a directional bias could flow from the higher timeframe charts. It is evident that staying in a more significant trend will most likely end in a reward.
Many types of traders like short term, Day traders, intraday traders, and scalpers rely upon the trend. Trading in a Daily chart time frame will provide bigger profits as the trends which develop In higher timeframe charts tend to stay longer and stronger. But they also require a bigger stop loss in case of adverse results. Many day traders or Intraday traders may not be able to have a wider stop loss attached to their position. Still, they would like to ride the trend and make higher profits than the daily charts.
By trading the top down approach, the trader is able to ride the trend displayed in the higher timeframe chart from a lower timeframe chart. Similar to chart analysis, the trader first chooses a higher time frame chart and then narrows it down to a smaller chart. The indicators should also incorporate the same method to have outstanding results. That’s it! Here’s our guide for the widely searched “Best Forex Strategy for Consistent Profits”


