The exhaustion gap pattern is a significant indicator in technical analysis, often signaling the end of a prevailing trend. Understanding how to trade the bearish exhaustion gap pattern can be a powerful tool in a trader's arsenal. This article will delve into what an exhaustion gap pattern is, how to spot a bearish exhaustion gap, and strategies to trade it effectively.
What is the Exhaustion Gap Pattern?
An exhaustion gap pattern occurs when there is a sharp price movement in the direction of the current trend, followed by a gap in the price chart. This gap often signals the final push of the trend before a reversal. There are several types of price gaps in financial markets, including breakaway gaps, runaway gaps, and common gaps.
However, the exhaustion gap represents a critical point where the trend is likely to reverse. This gap is usually seen as the last effort of the current trend, indicating that the market is nearing a significant reversal.
Also Read: Learn New Gap Trading Strategies
How to Spot the Bearish Exhaustion Gap Pattern

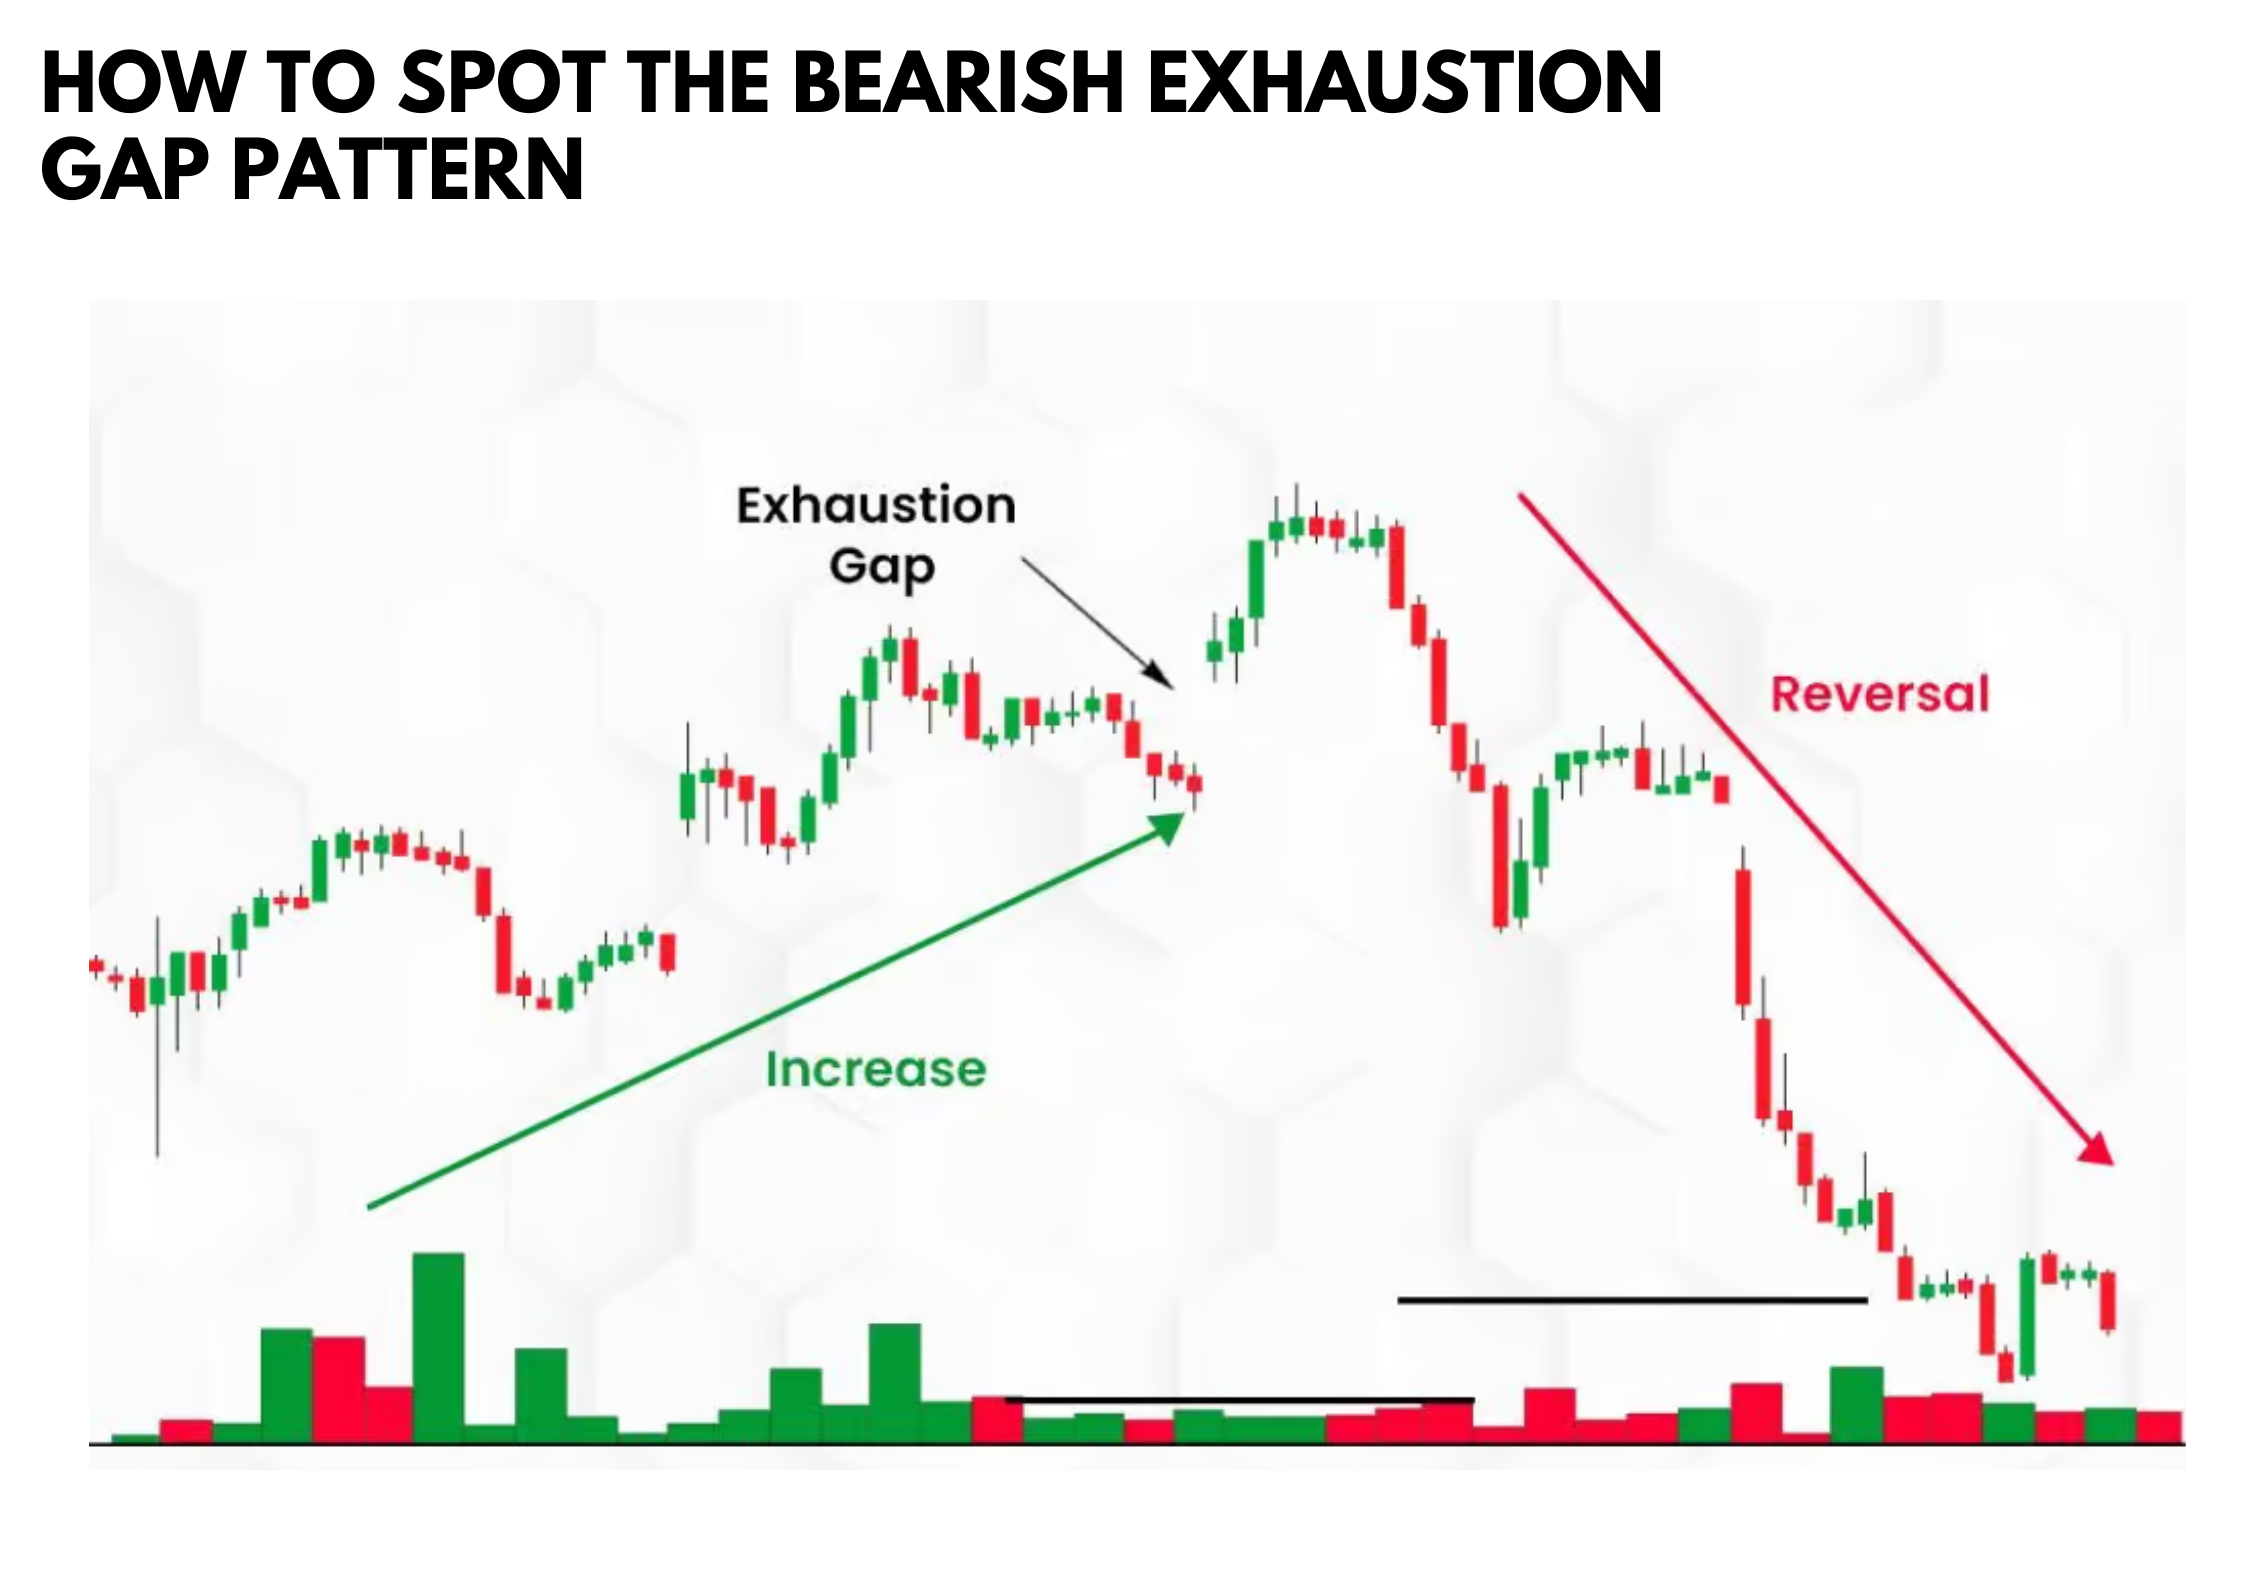
Spotting a bearish exhaustion gap involves identifying specific characteristics on a price chart. The bearish exhaustion gap occurs towards the end of an upward trend, where the price opens significantly lower than the previous closing price, creating a gap down. This gap is usually accompanied by high trading volume, indicating a final surge of selling pressure before the trend reverses.
Key Characteristics:
- Gap Down: The price opens lower than the previous close.
- High Volume: A significant increase in trading volume compared to the average trading day.
- Trend Reversal Indicators: Tools like the Relative Strength Index (RSI) can confirm overbought conditions, suggesting a potential reversal.
How to Trade the Bearish Exhaustion Gap Pattern
Entry Point

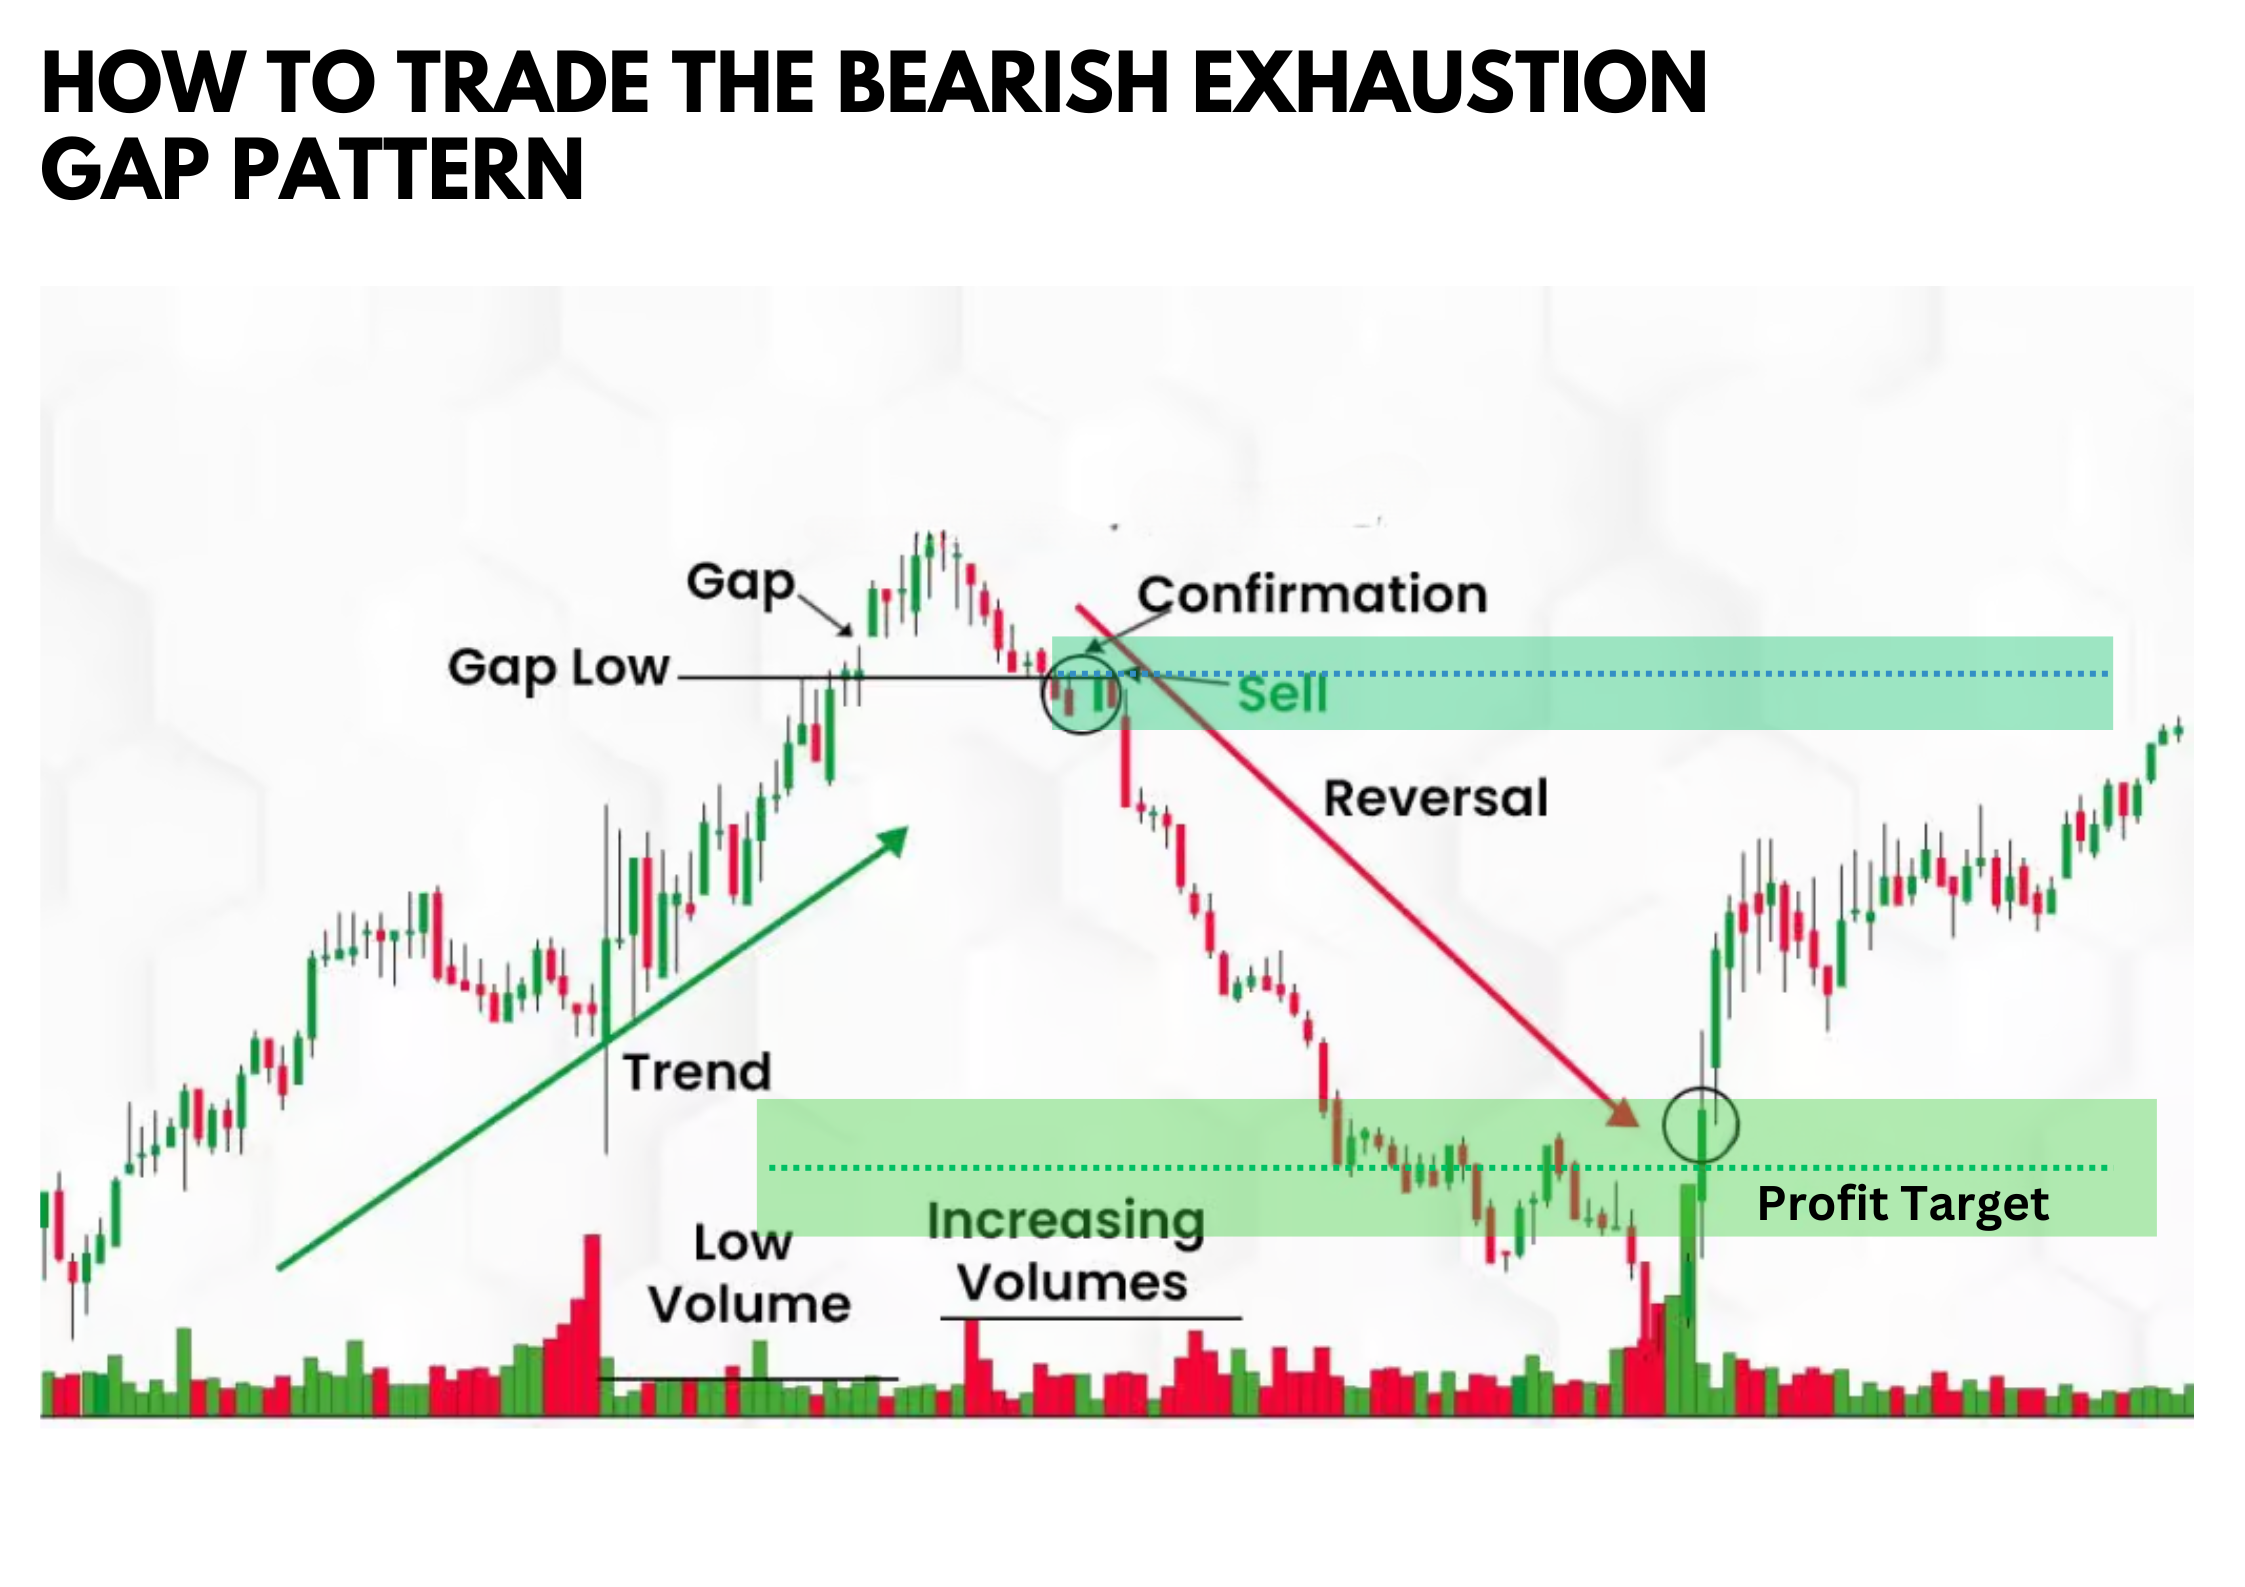
The entry point for trading a bearish exhaustion gap is crucial. Typically, traders enter a short position when the price breaks below the gap range. This price action confirms the exhaustion gap and signals a bearish reversal.
Stop Loss

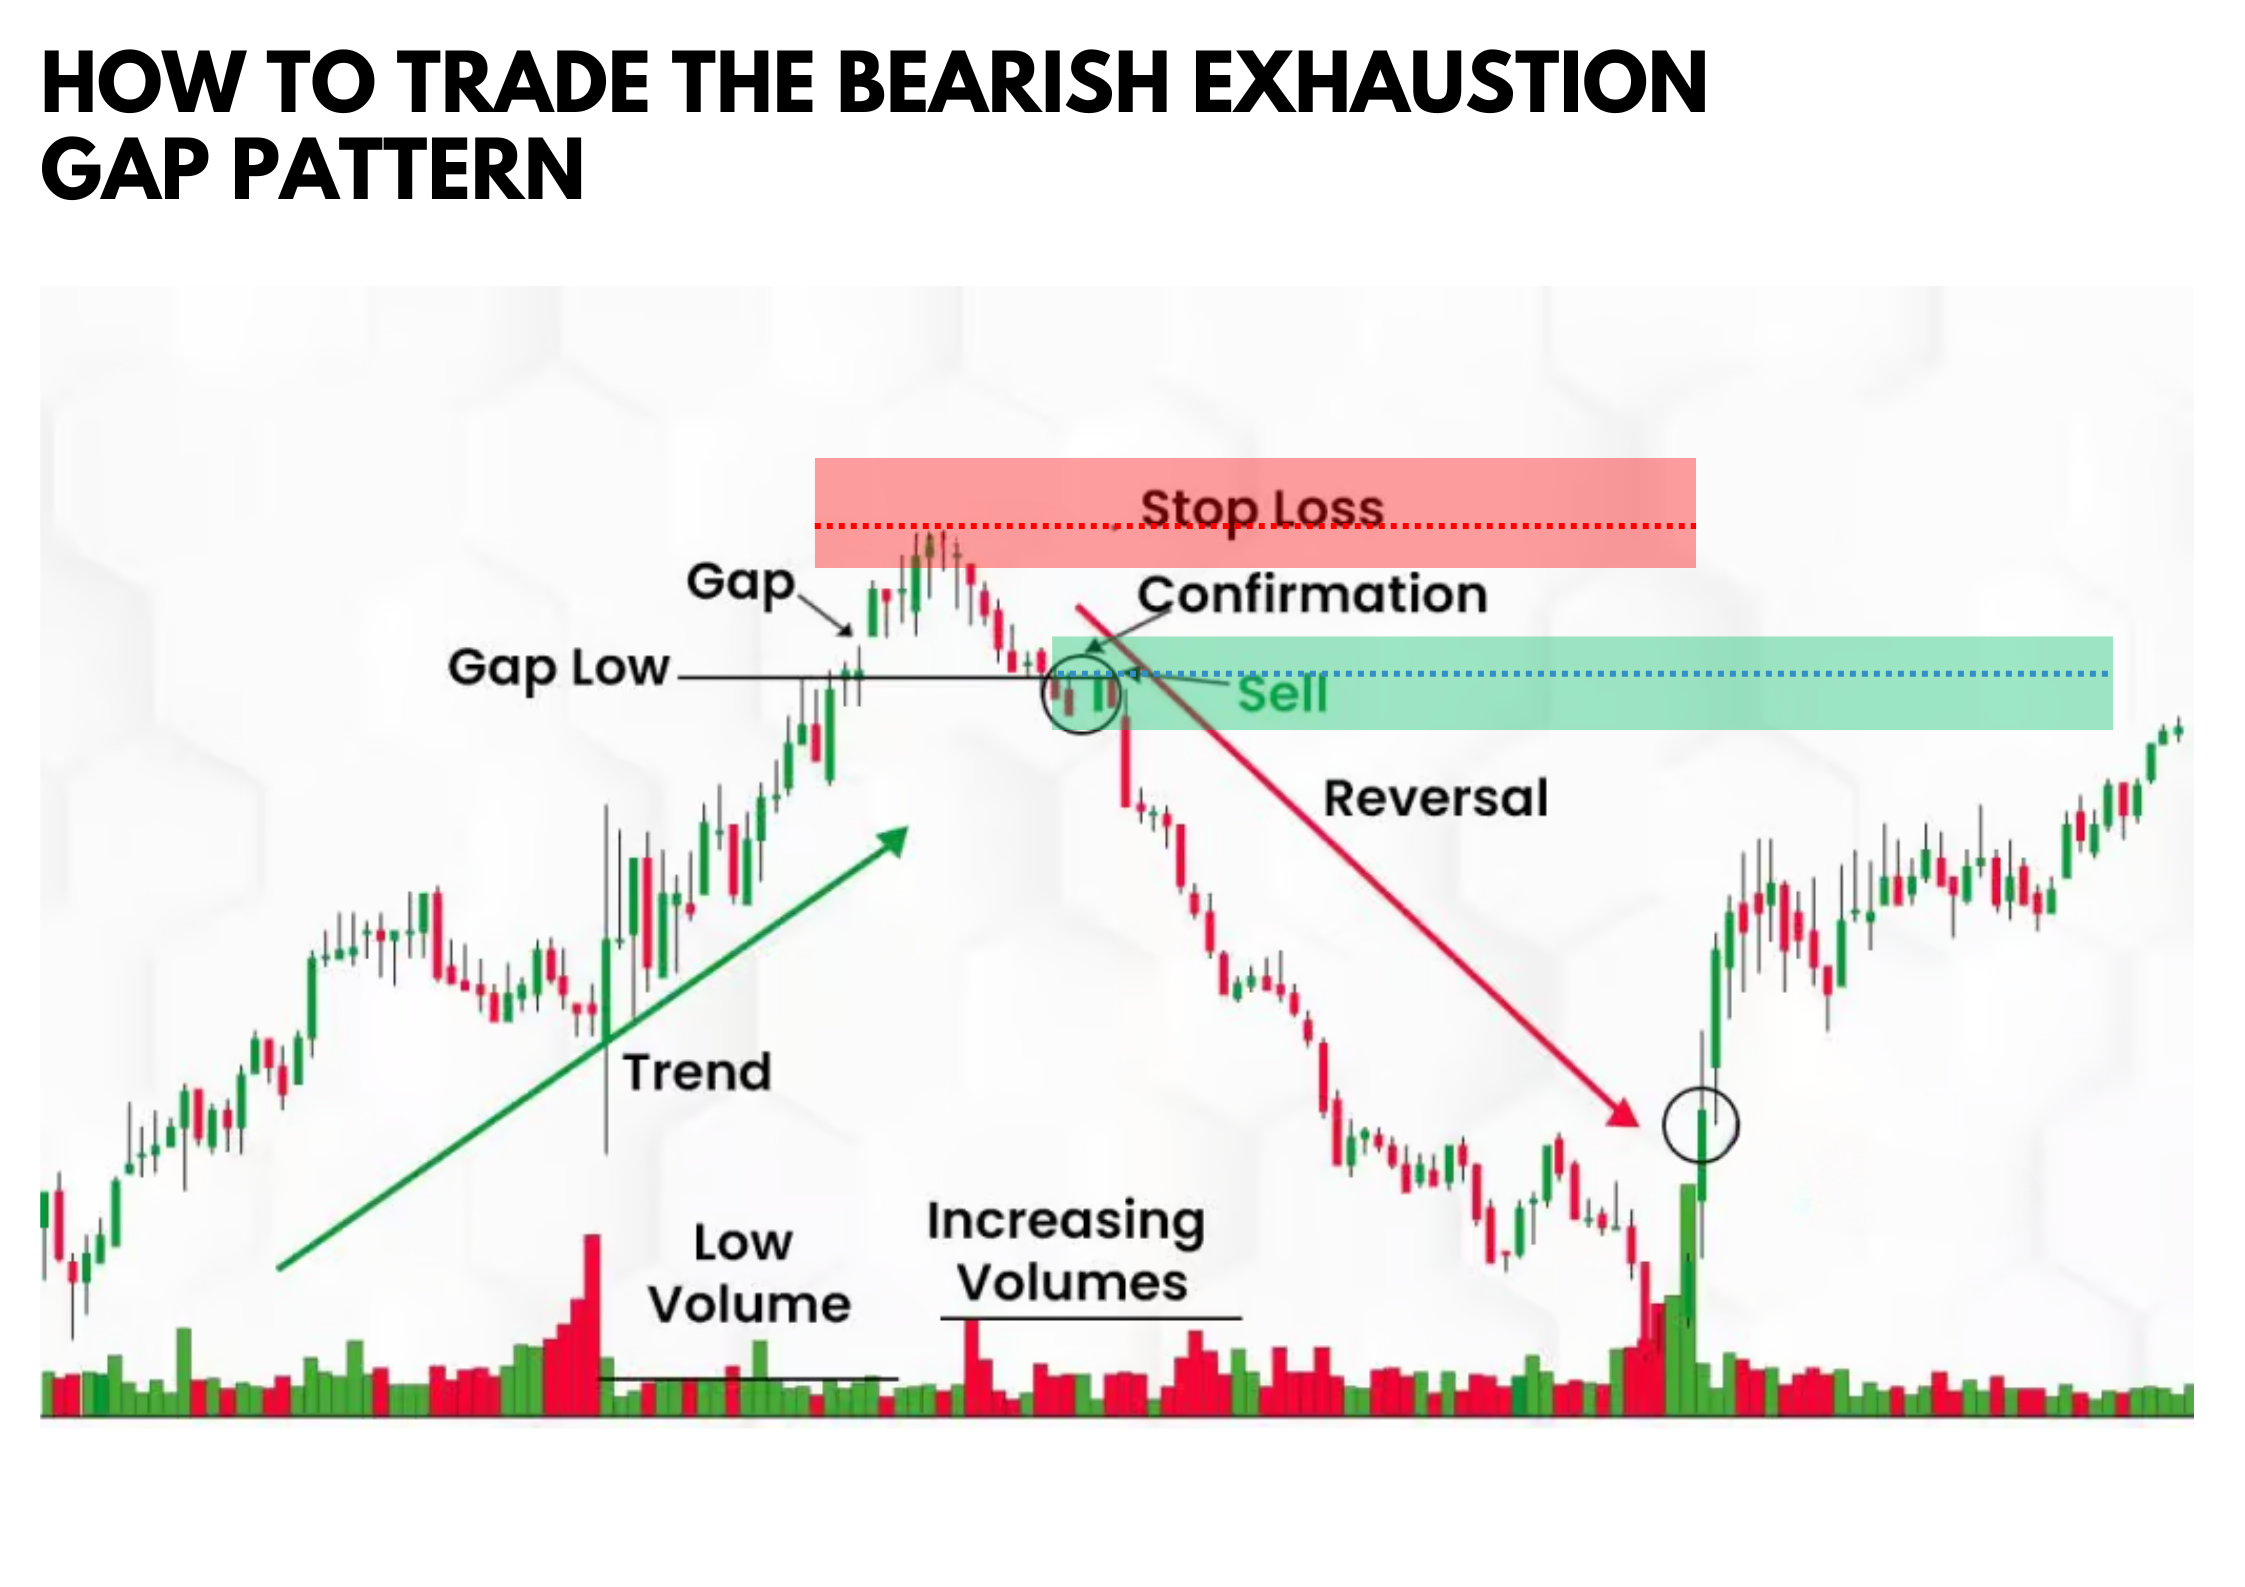
Setting a stop loss is essential to manage risk. A common strategy is to place the stop loss above the high of the exhaustion gap. This protects against unexpected price movements that may negate the bearish trend.
Profit Target
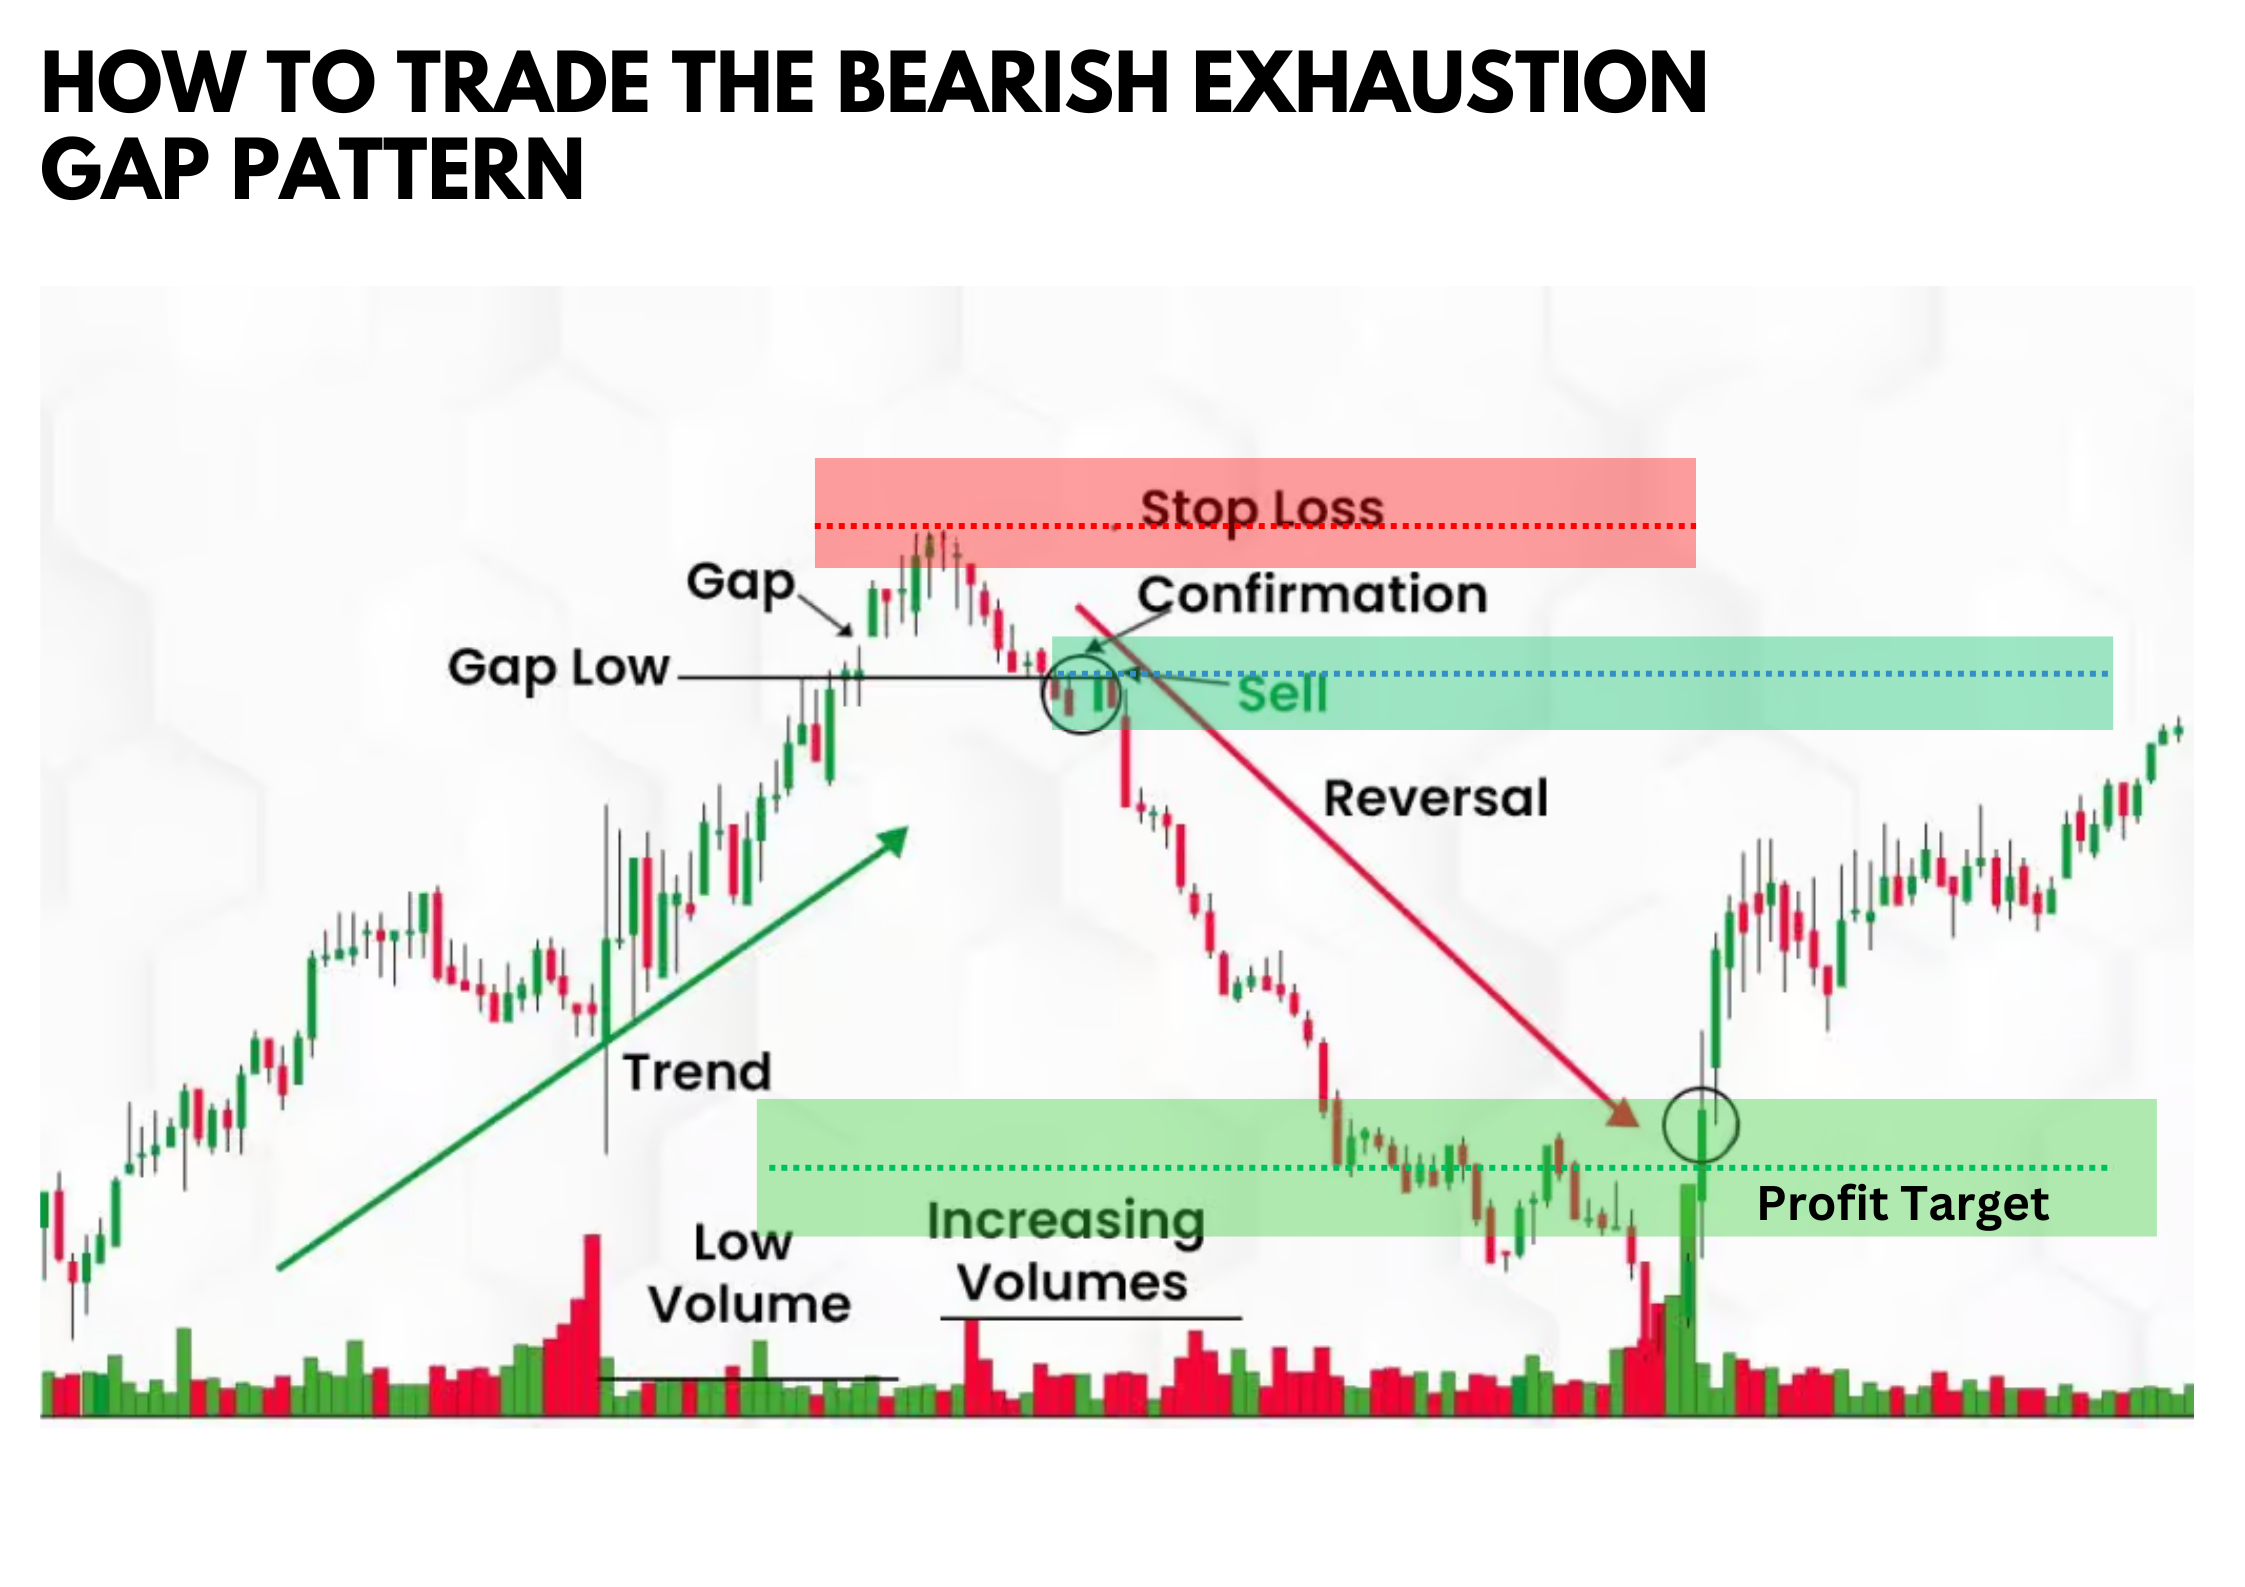
Profit targets can be set using various methods. One approach is to aim for a price level where the gap represents roughly half the range of the previous upward trend. This aligns with classical gap trading approaches, where the gap implies a significant reversal.
Pros and Cons of the Bearish Exhaustion Gap Pattern
Pros
- The bearish exhaustion gap provides clear entry and exit signals.
- When confirmed by other indicators, it offers a high probability of a successful trade.
- It often signals a strong trend reversal, allowing traders to capitalize on significant price movements.
Cons
- Without proper confirmation, exhaustion gaps can lead to false signals.
- Trading exhaustion gaps can involve high volatility, requiring careful risk management.
- High trading volumes are necessary for confirming the pattern, which may not always be present.
Indicators to Use to Confirm the Pattern
Several technical analysis tools can confirm the bearish exhaustion gap pattern:
Relative Strength Index (RSI)
Relative Strength Index (RSI) can indicate overbought conditions, suggesting a potential bearish reversal. When the RSI is above 70, it often signals that the asset is overbought and may soon experience selling pressure, leading to a downward price movement. This makes RSI a valuable tool in confirming an exhaustion gap pattern, as it highlights the market's overextended state and the likelihood of a trend reversal.RSI can indicate overbought conditions, suggesting a potential bearish reversal.
Volume Analysis
High volume during the gap occurrence is critical to confirming the exhaustion gap. When trading volumes spike significantly as the gap forms, it indicates strong selling or buying interest that often marks the climax of the current trend. This surge in volume confirms that the market participants are heavily involved, making the gap more reliable as an indicator of an impending reversal.
Trend Line
A broken upward trend line can signal the end of a bullish trend and the beginning of a bearish trend. When the price action breaks below a well-established upward trend line, it demonstrates a shift in market sentiment from bullish to bearish. This break is a key confirmation for a bearish exhaustion gap, as it signifies that the support level has been breached and a new downward trend may be underway.
Momentum Indicators
Momentum Indicators like the MACD can help confirm the shift in market sentiment. The MACD, which tracks the difference between two moving averages, can signal a change in momentum when it crosses above or below the signal line. A bearish crossover in the MACD can reinforce the bearish exhaustion gap, indicating that the momentum is now favoring sellers and that a downward trend is likely to follow.
Conclusion
Trading the bearish exhaustion gap pattern requires a keen eye for detail and the use of multiple technical analysis tools to confirm signals. By understanding how to spot and trade this pattern, traders can effectively capitalize on significant market reversals. Always remember to manage risk with appropriate stop-loss levels and to confirm signals with reliable indicators.
Also Read: How to Trade the Matching Low Pattern
FAQs
What is the difference between an exhaustion gap and a breakaway gap?
An exhaustion gap occurs at the end of a trend, signaling a reversal, while a breakaway gap occurs at the beginning of a new trend, signaling a breakout.
How can I confirm an exhaustion gap pattern?
Use indicators like the Relative Strength Index (RSI), high trading volume, and broken trend lines to confirm an exhaustion gap pattern.
What are the risks of trading exhaustion gaps?
The main risks include false signals and high volatility. Proper risk management and confirmation with multiple indicators can mitigate these risks.


