In technical analysis, candlestick patterns are vital tools for identifying potential trend reversals. Among these, the bearish counterattack lines pattern is particularly notable. This two-candle reversal pattern, part of the broader category of candlestick patterns, signals a potential shift in market sentiment from bullish to bearish. Understanding how to trade this pattern effectively can be a game-changer for traders looking to capitalize on bearish reversals. In this article, we will explore the intricacies of the bearish counterattack lines pattern and provide practical strategies for trading it.
What is the Bearish Counterattack Lines Pattern?
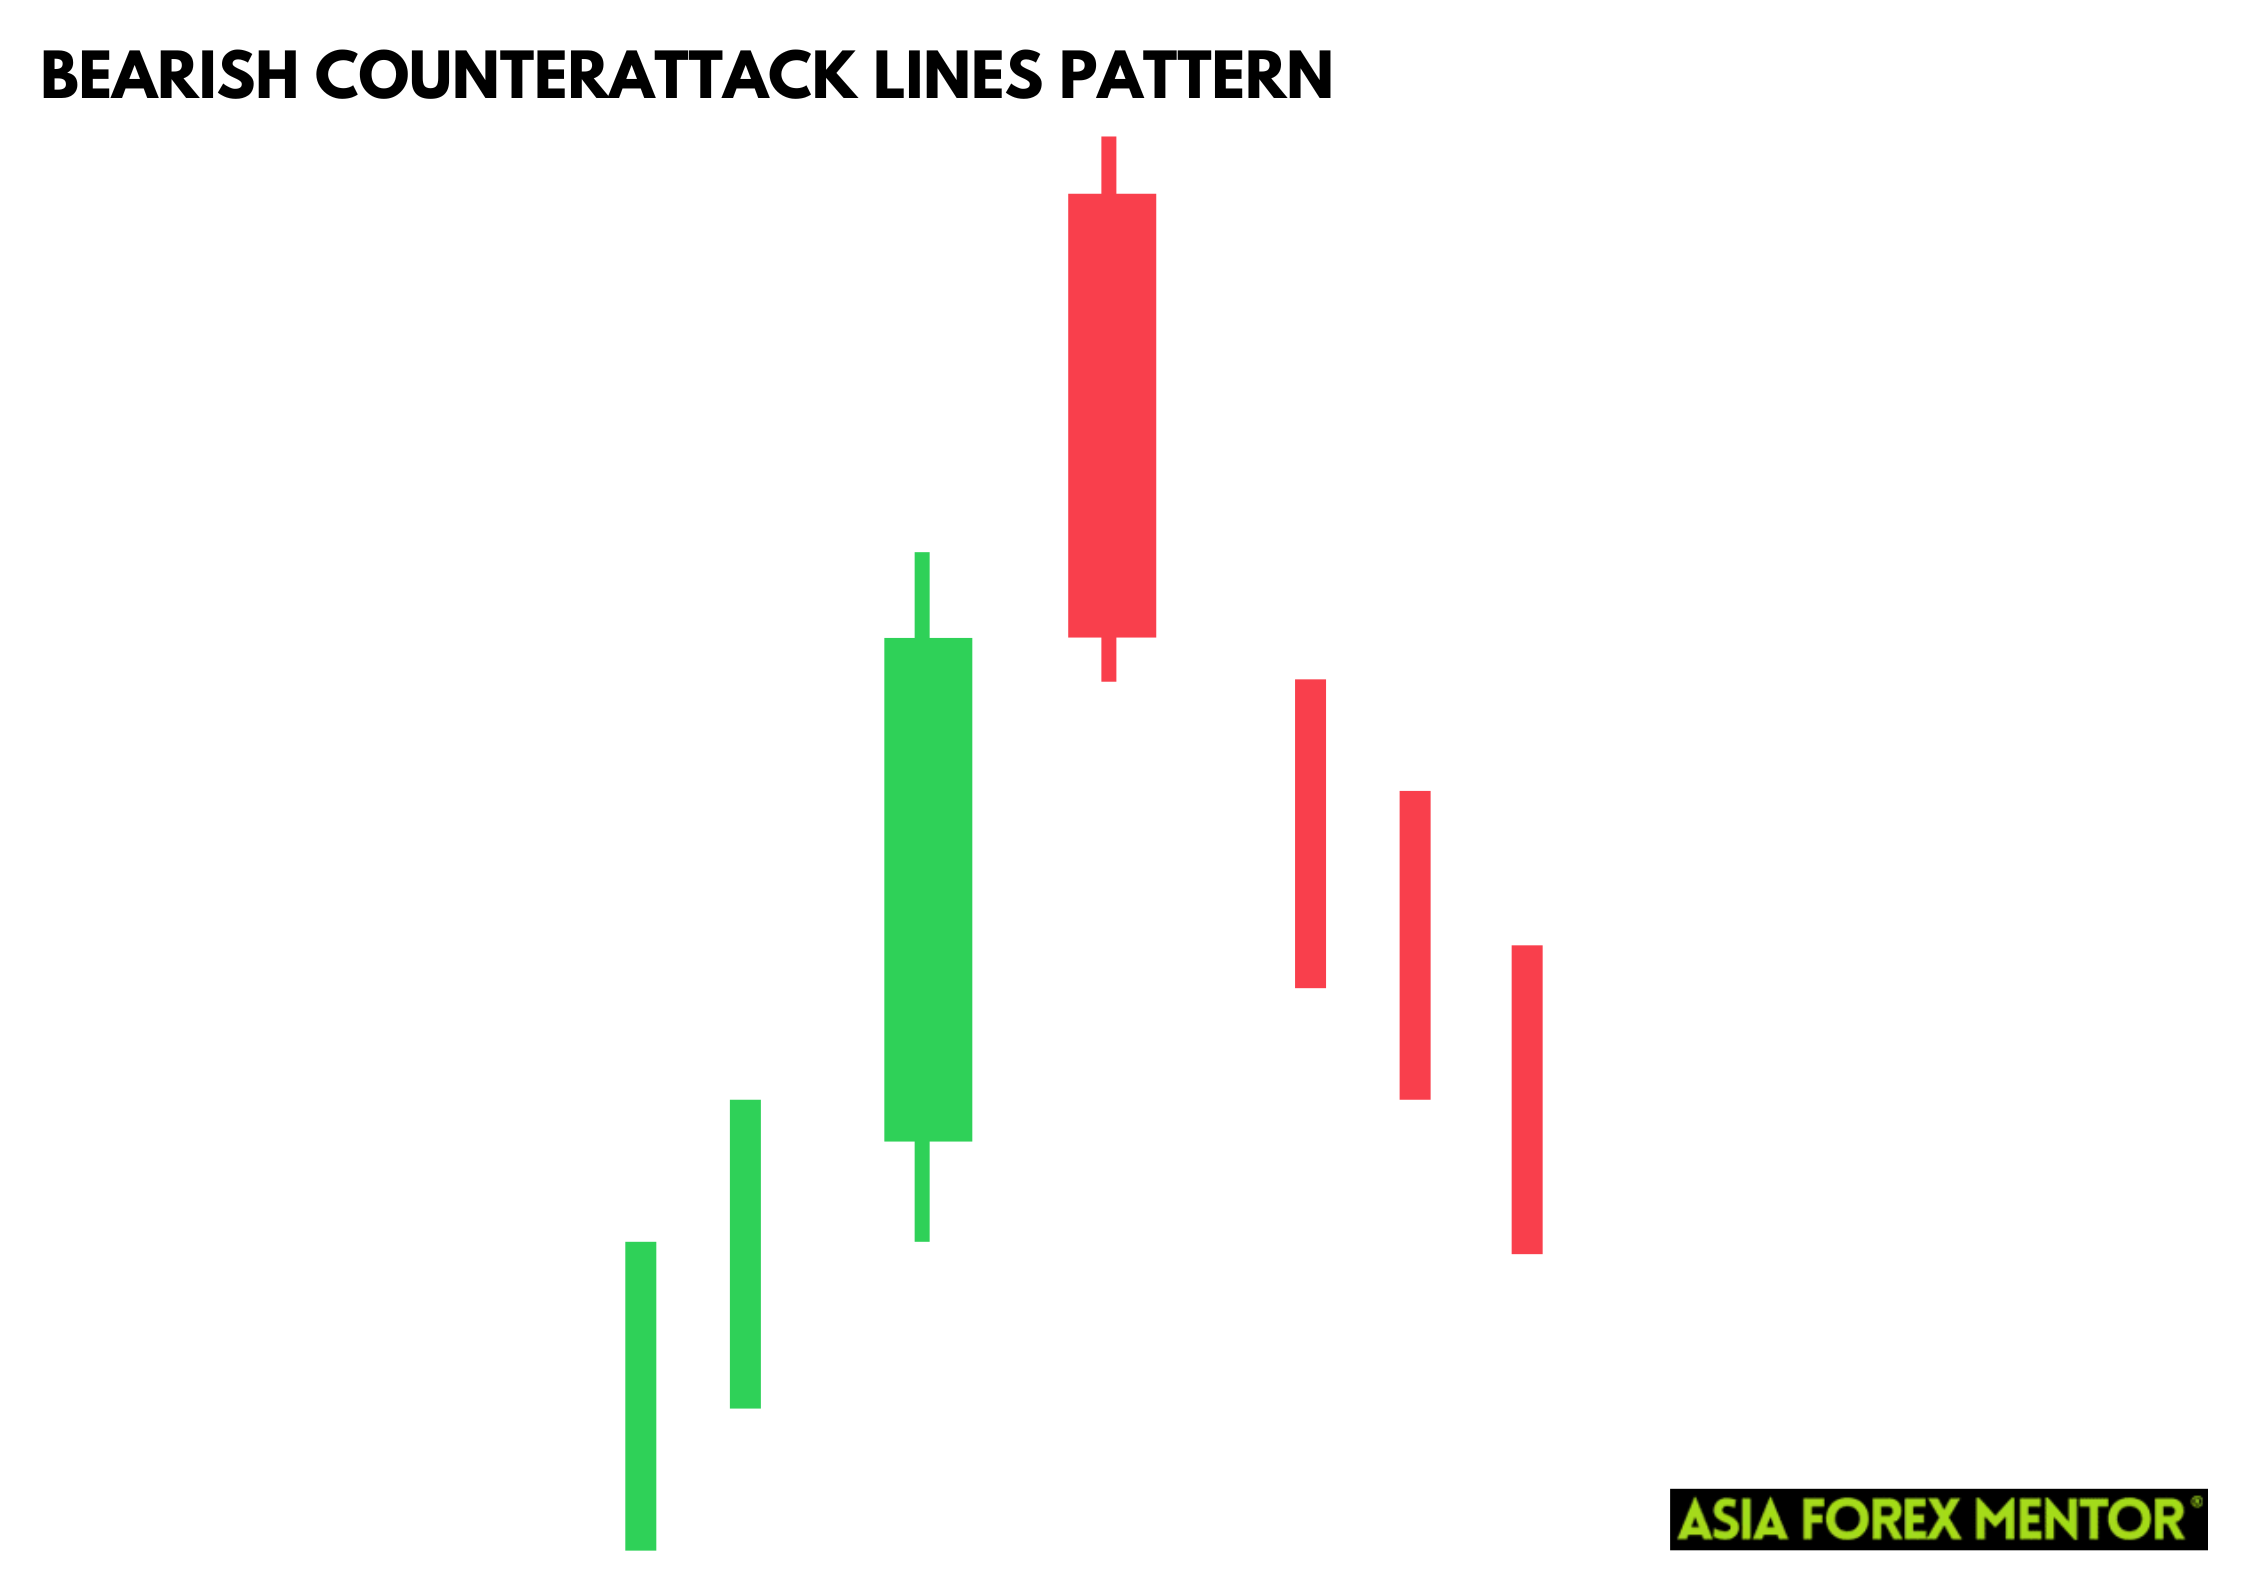
The bearish counterattack lines pattern is a two-candle reversal pattern that appears during an upward trend, signifying a notable shift in market dynamics. It starts with a white bullish candle, indicating strong buying pressure and reinforcing the current bullish sentiment. However, the pattern takes a significant turn with the second candle, which opens higher but closes at or near the previous candle's close. This shift indicates that the initial bullish momentum has been effectively neutralized by robust selling pressure, suggesting a potential bearish reversal.
Traders interpret this pattern as a warning sign of a possible trend reversal. The abrupt shift from bullish to bearish sentiment can prompt traders to reconsider their positions, particularly if this pattern occurs near key resistance levels or after a prolonged upward trend. The bearish counterattack candlestick pattern becomes even more reliable when confirmed by other technical analysis tools such as volume analysis or momentum indicators like RSI or MACD. Recognizing and understanding this pattern enables traders to make more informed decisions, adjusting their strategies to align with the evolving market conditions.
Also Read: Mastering Japanese Candlestick Patterns
How to Spot the Bearish Counterattack Lines Pattern
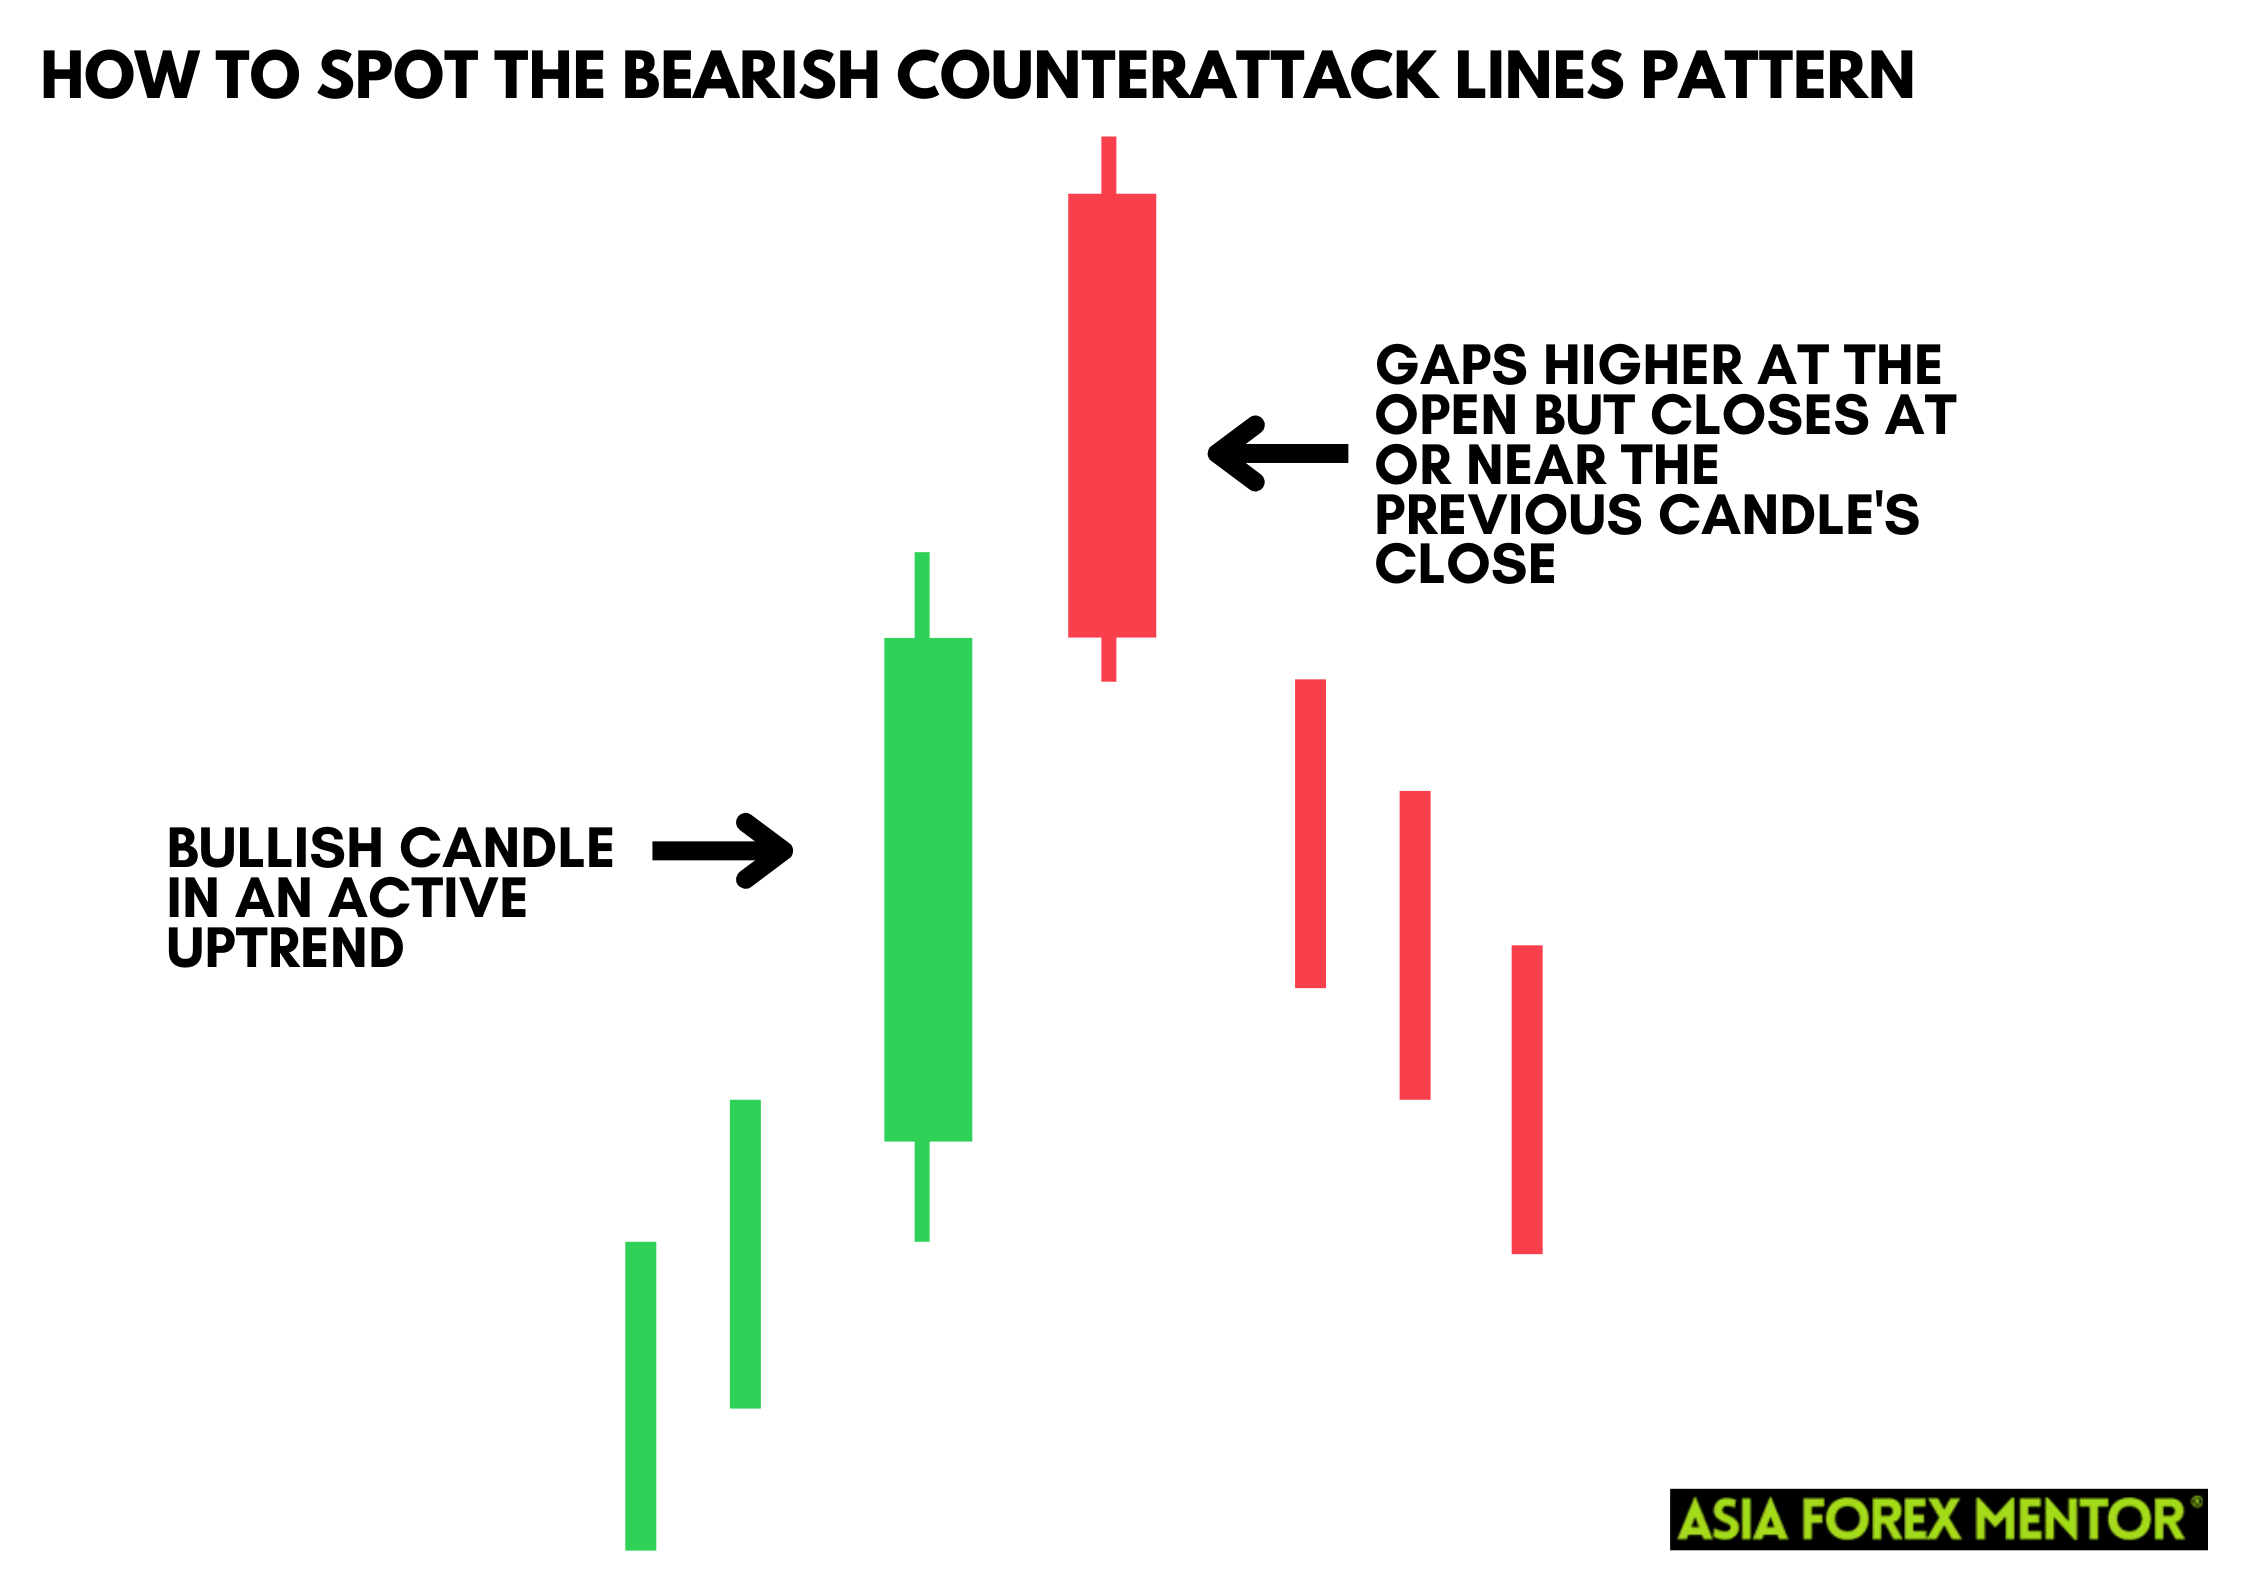
Identifying the bearish counterattack lines pattern on candlestick charts is crucial for traders aiming to predict potential trend reversals. Here’s how to spot it:
- First Candle: The pattern begins with a bullish candle, often occurring in an active uptrend, showing strong buying pressure.
- Second Candle: The second candle gaps higher at the open but closes at or near the previous candle's close, indicating selling pressure.
- Confirmation Candle: A confirmation candle following the bearish counterattack lines pattern adds reliability to the bearish reversal signal.
How to Trade the Bearish Counterattack Lines Pattern
Entry Point
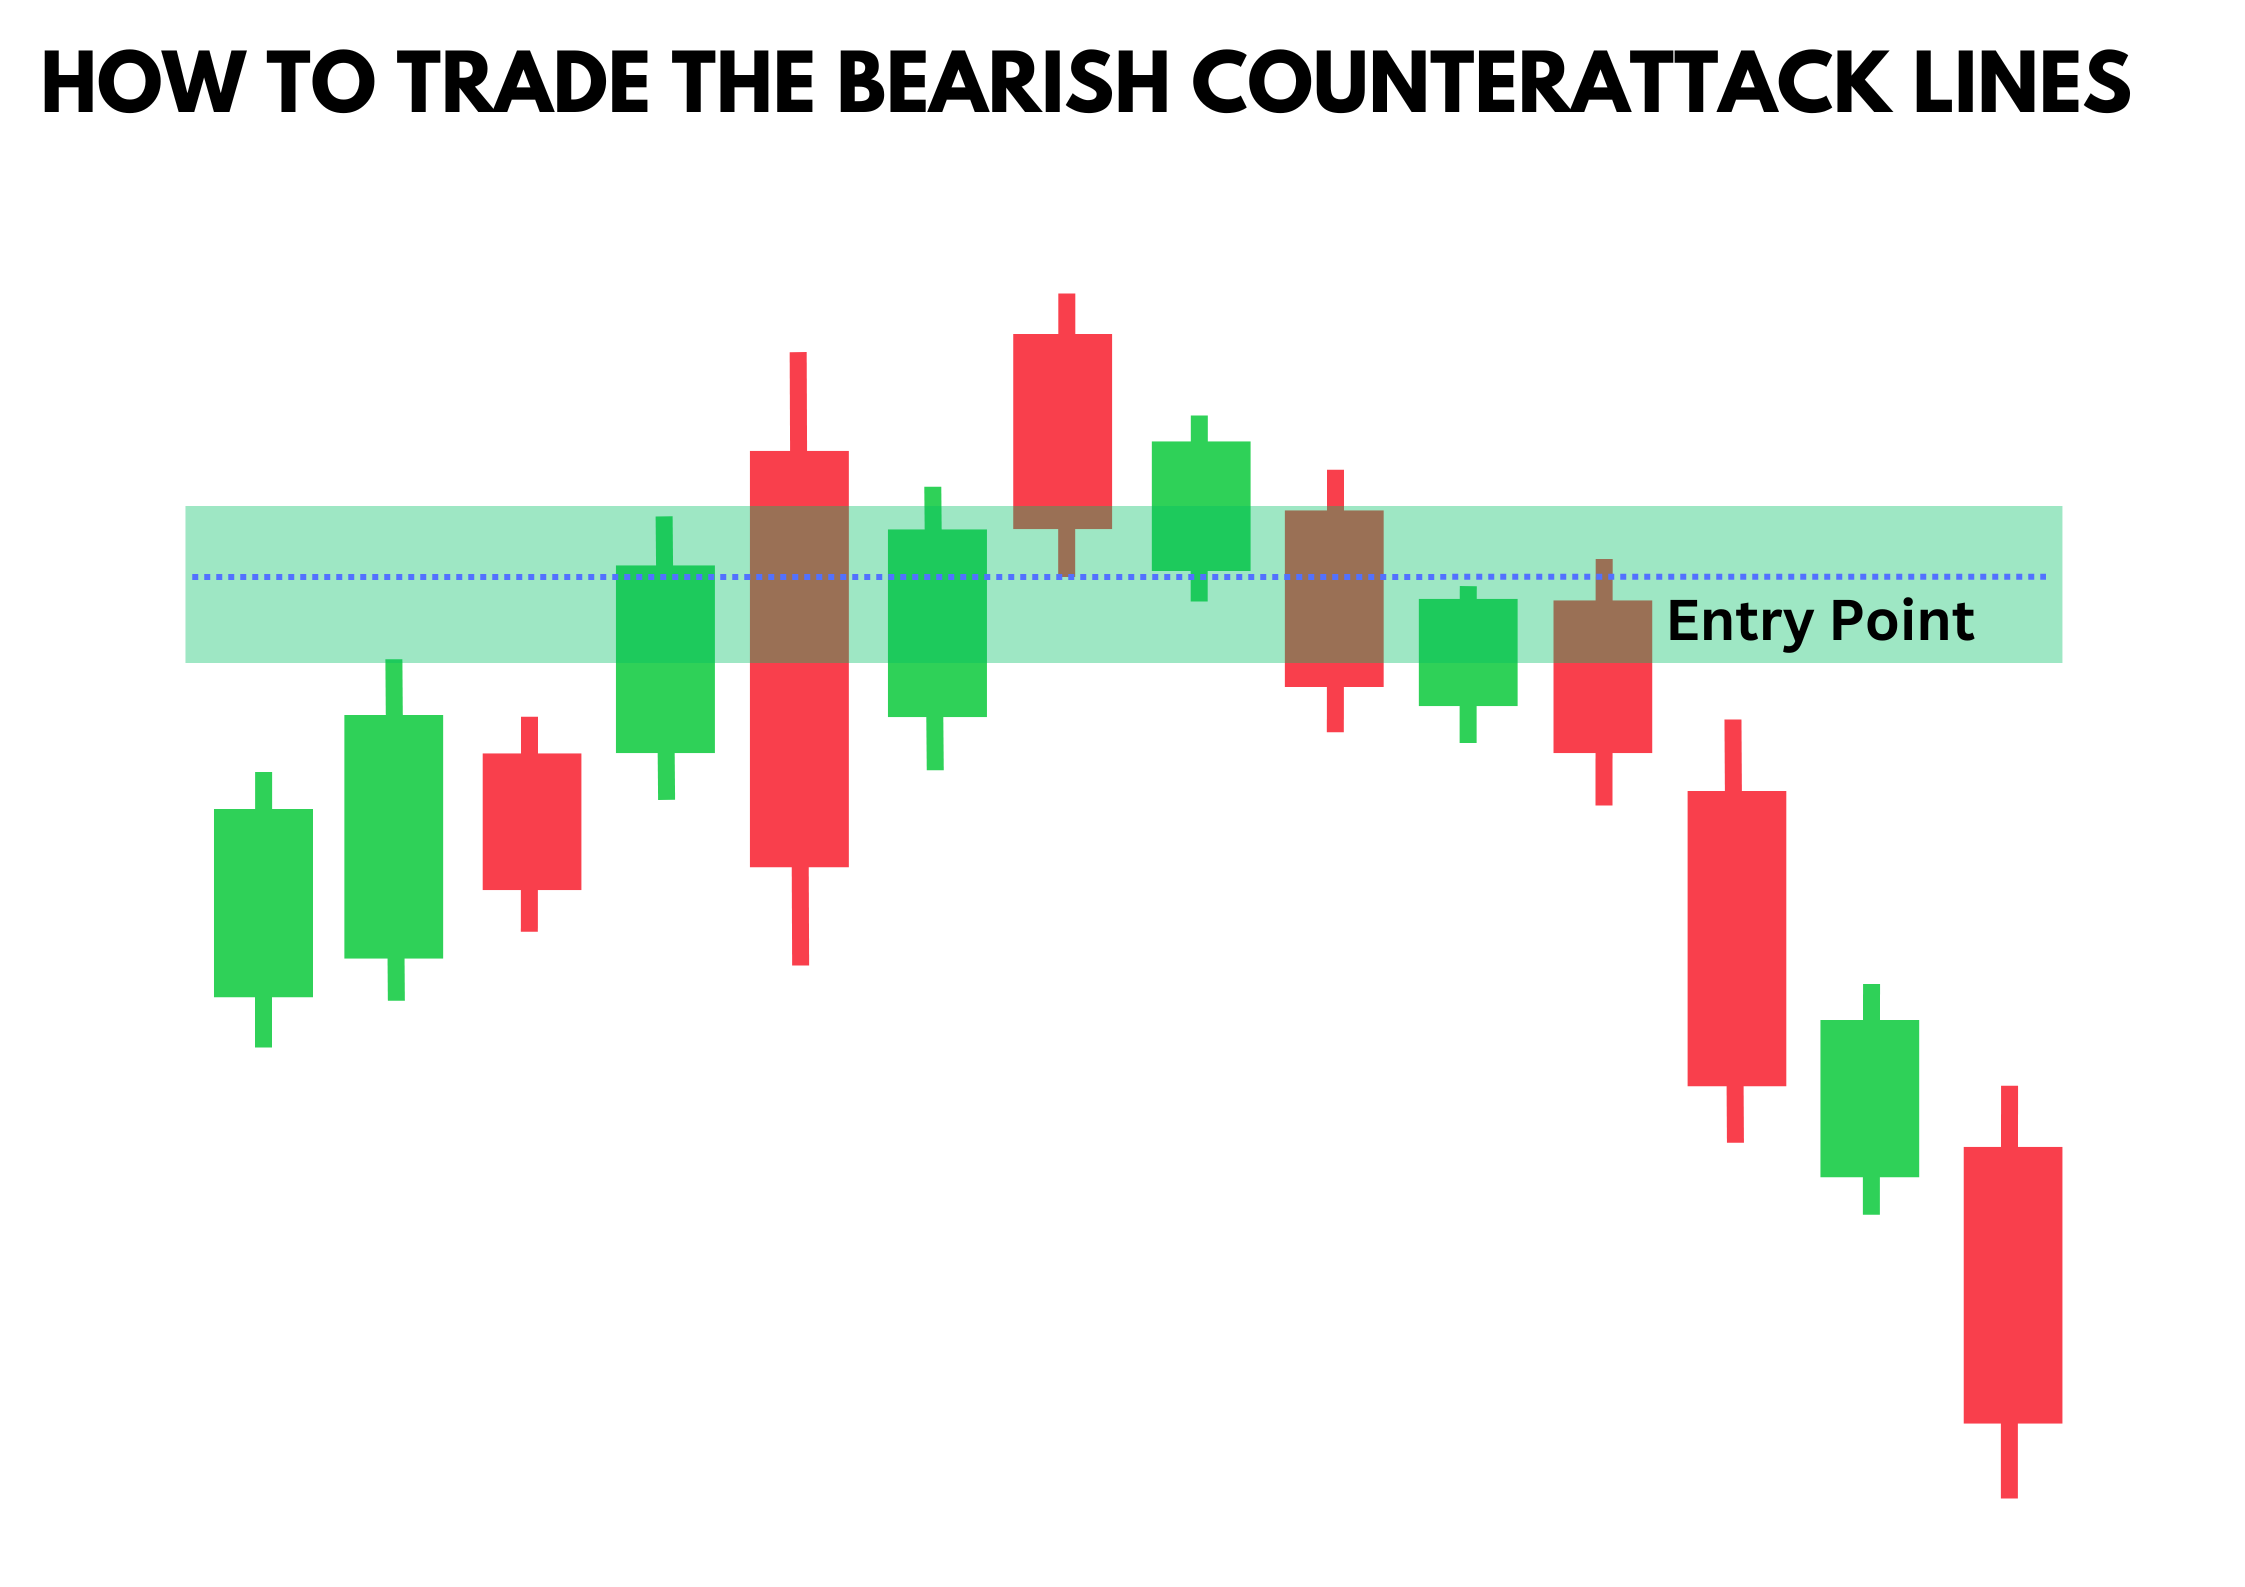
The entry point for trading the bearish counterattack lines pattern is crucial for confirming the bearish reversal signal while minimizing the risk of false breakouts. Typically, traders set their entry point just below the close of the second candle. This strategic placement ensures that the trader enters the market only after the bearish sentiment has been confirmed by the market action. By waiting for the price to drop below the second candle’s close, traders can be more confident that the bearish reversal is genuine and not a temporary fluctuation, thereby enhancing the reliability of their trade.
Stop Loss
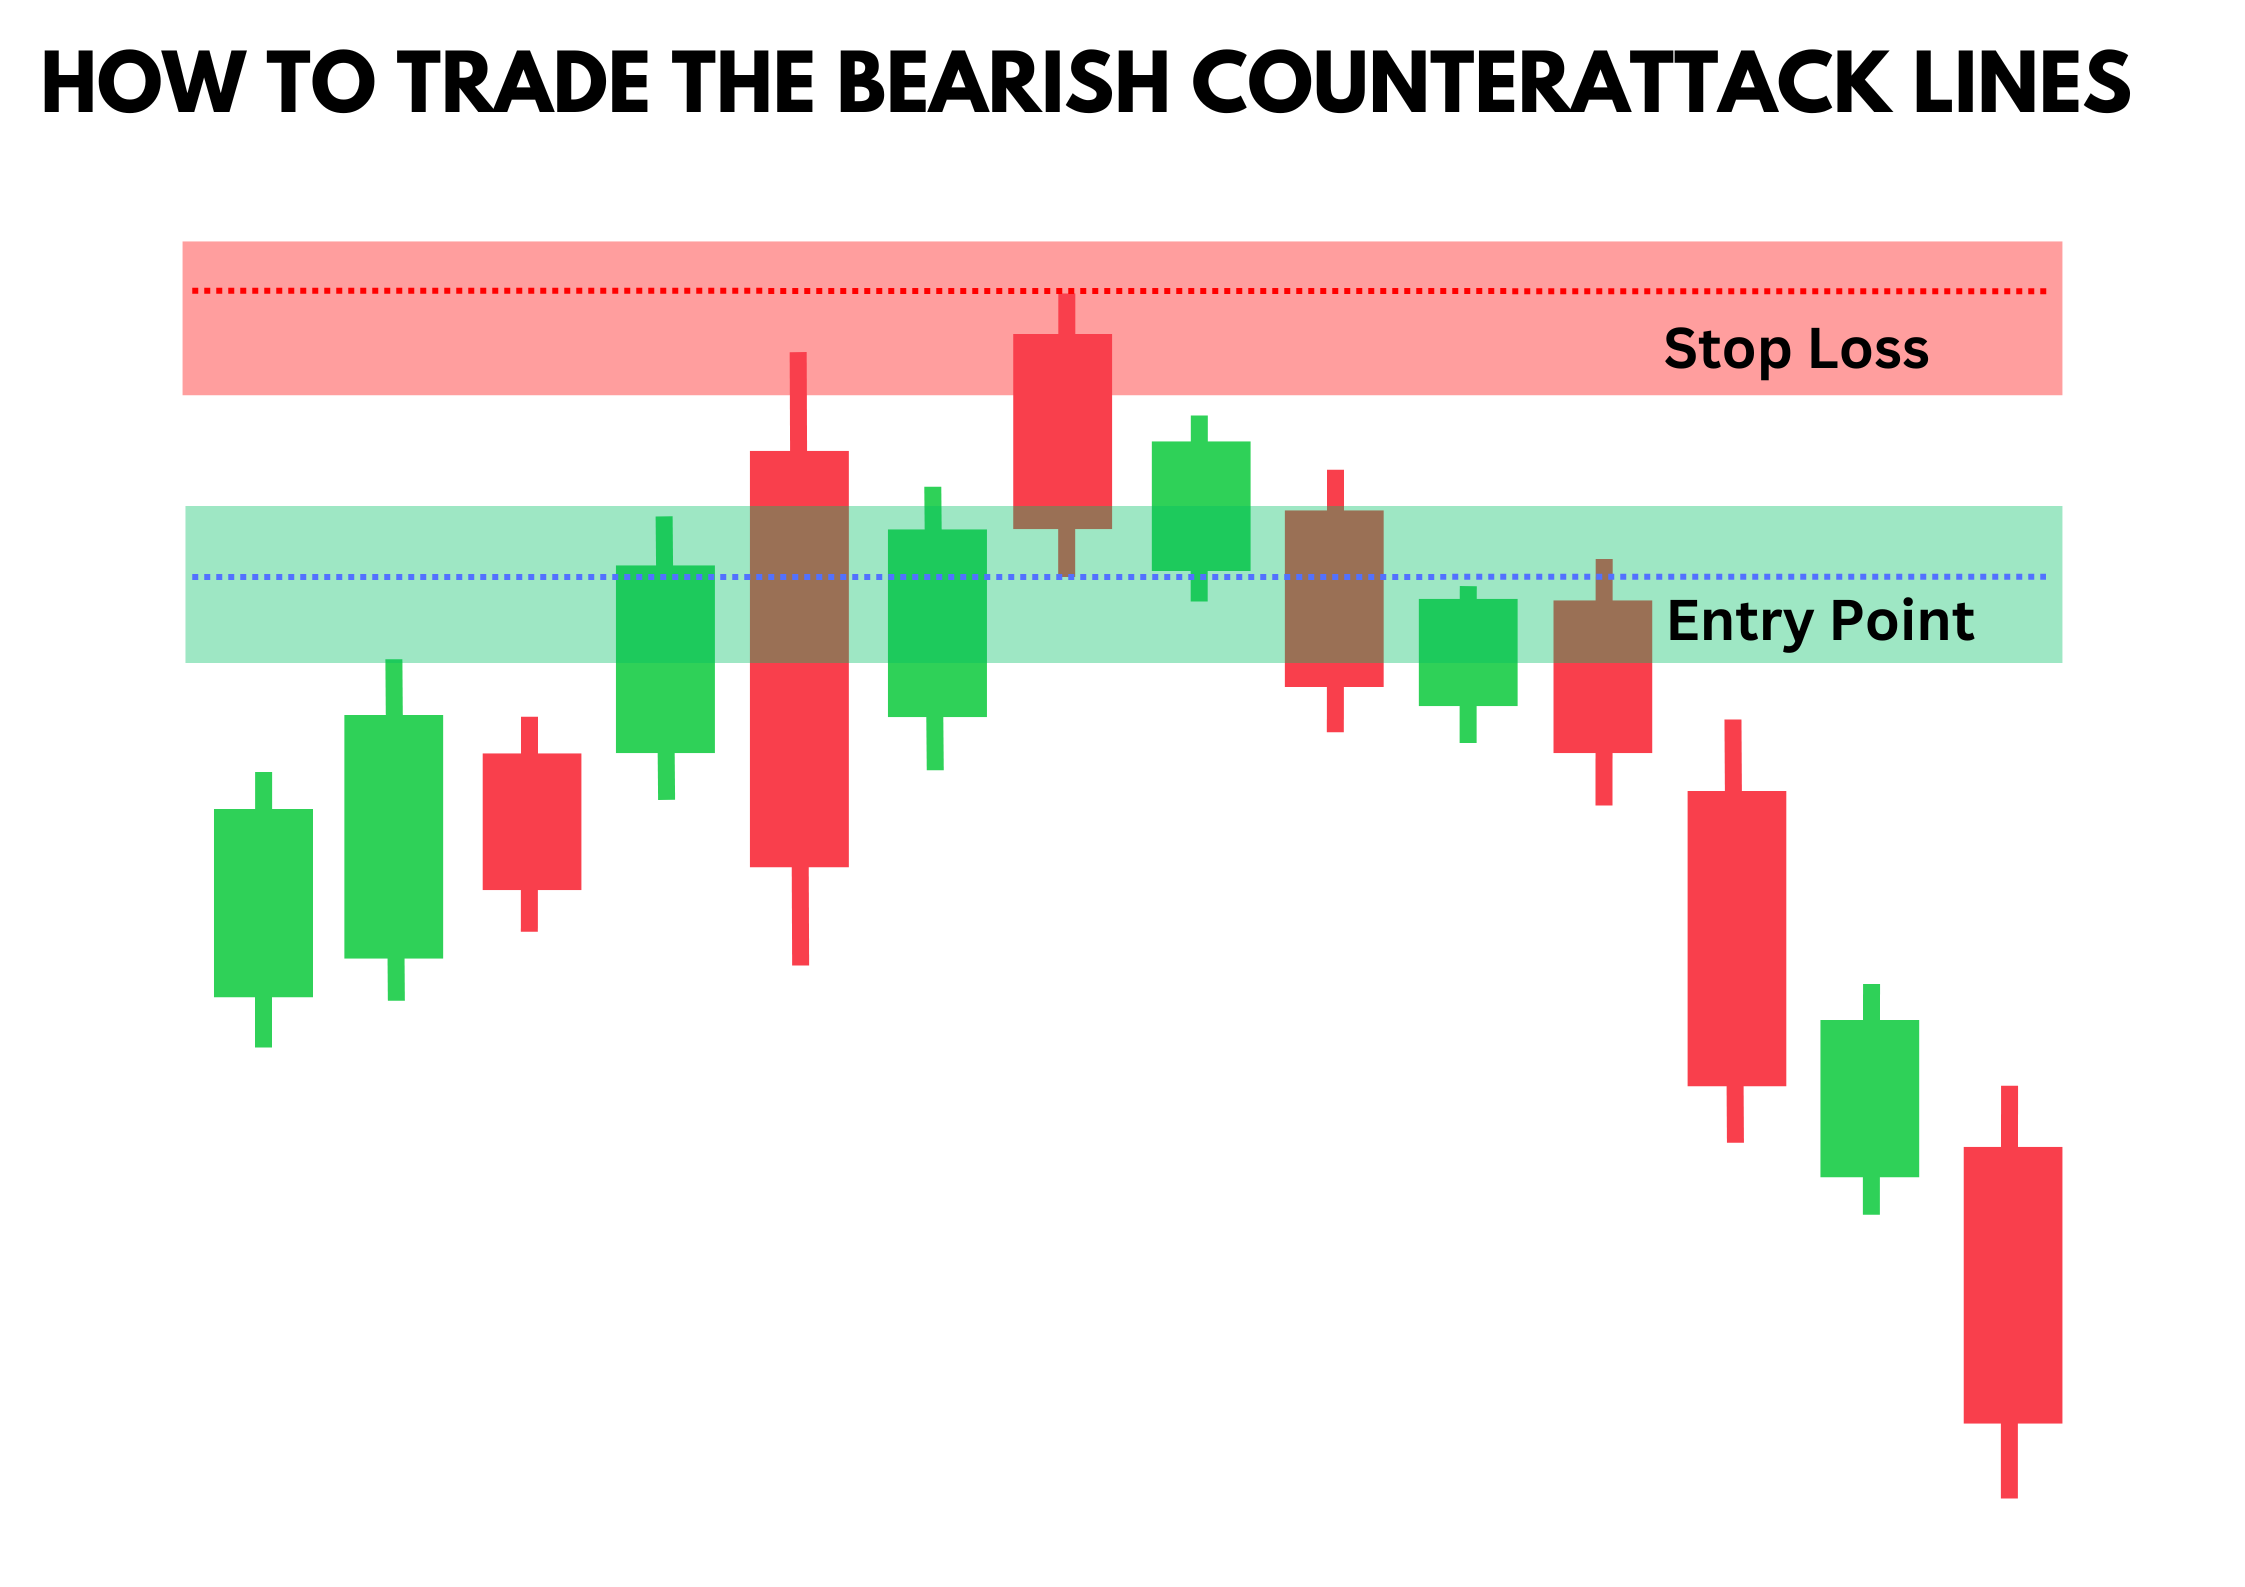
Implementing a stop loss is essential to manage risk effectively when trading the bearish counterattack lines pattern. The recommended placement for the stop loss is slightly above the high of the second candle. This placement protects traders from unexpected upward movements that could invalidate the bearish signal. If the price rises above this level, it indicates that the bearish reversal may not hold, and the market could continue its upward trend. By setting the stop loss above the second candle's high, traders can limit their losses and protect their capital from significant adverse price movements.
Profit Target
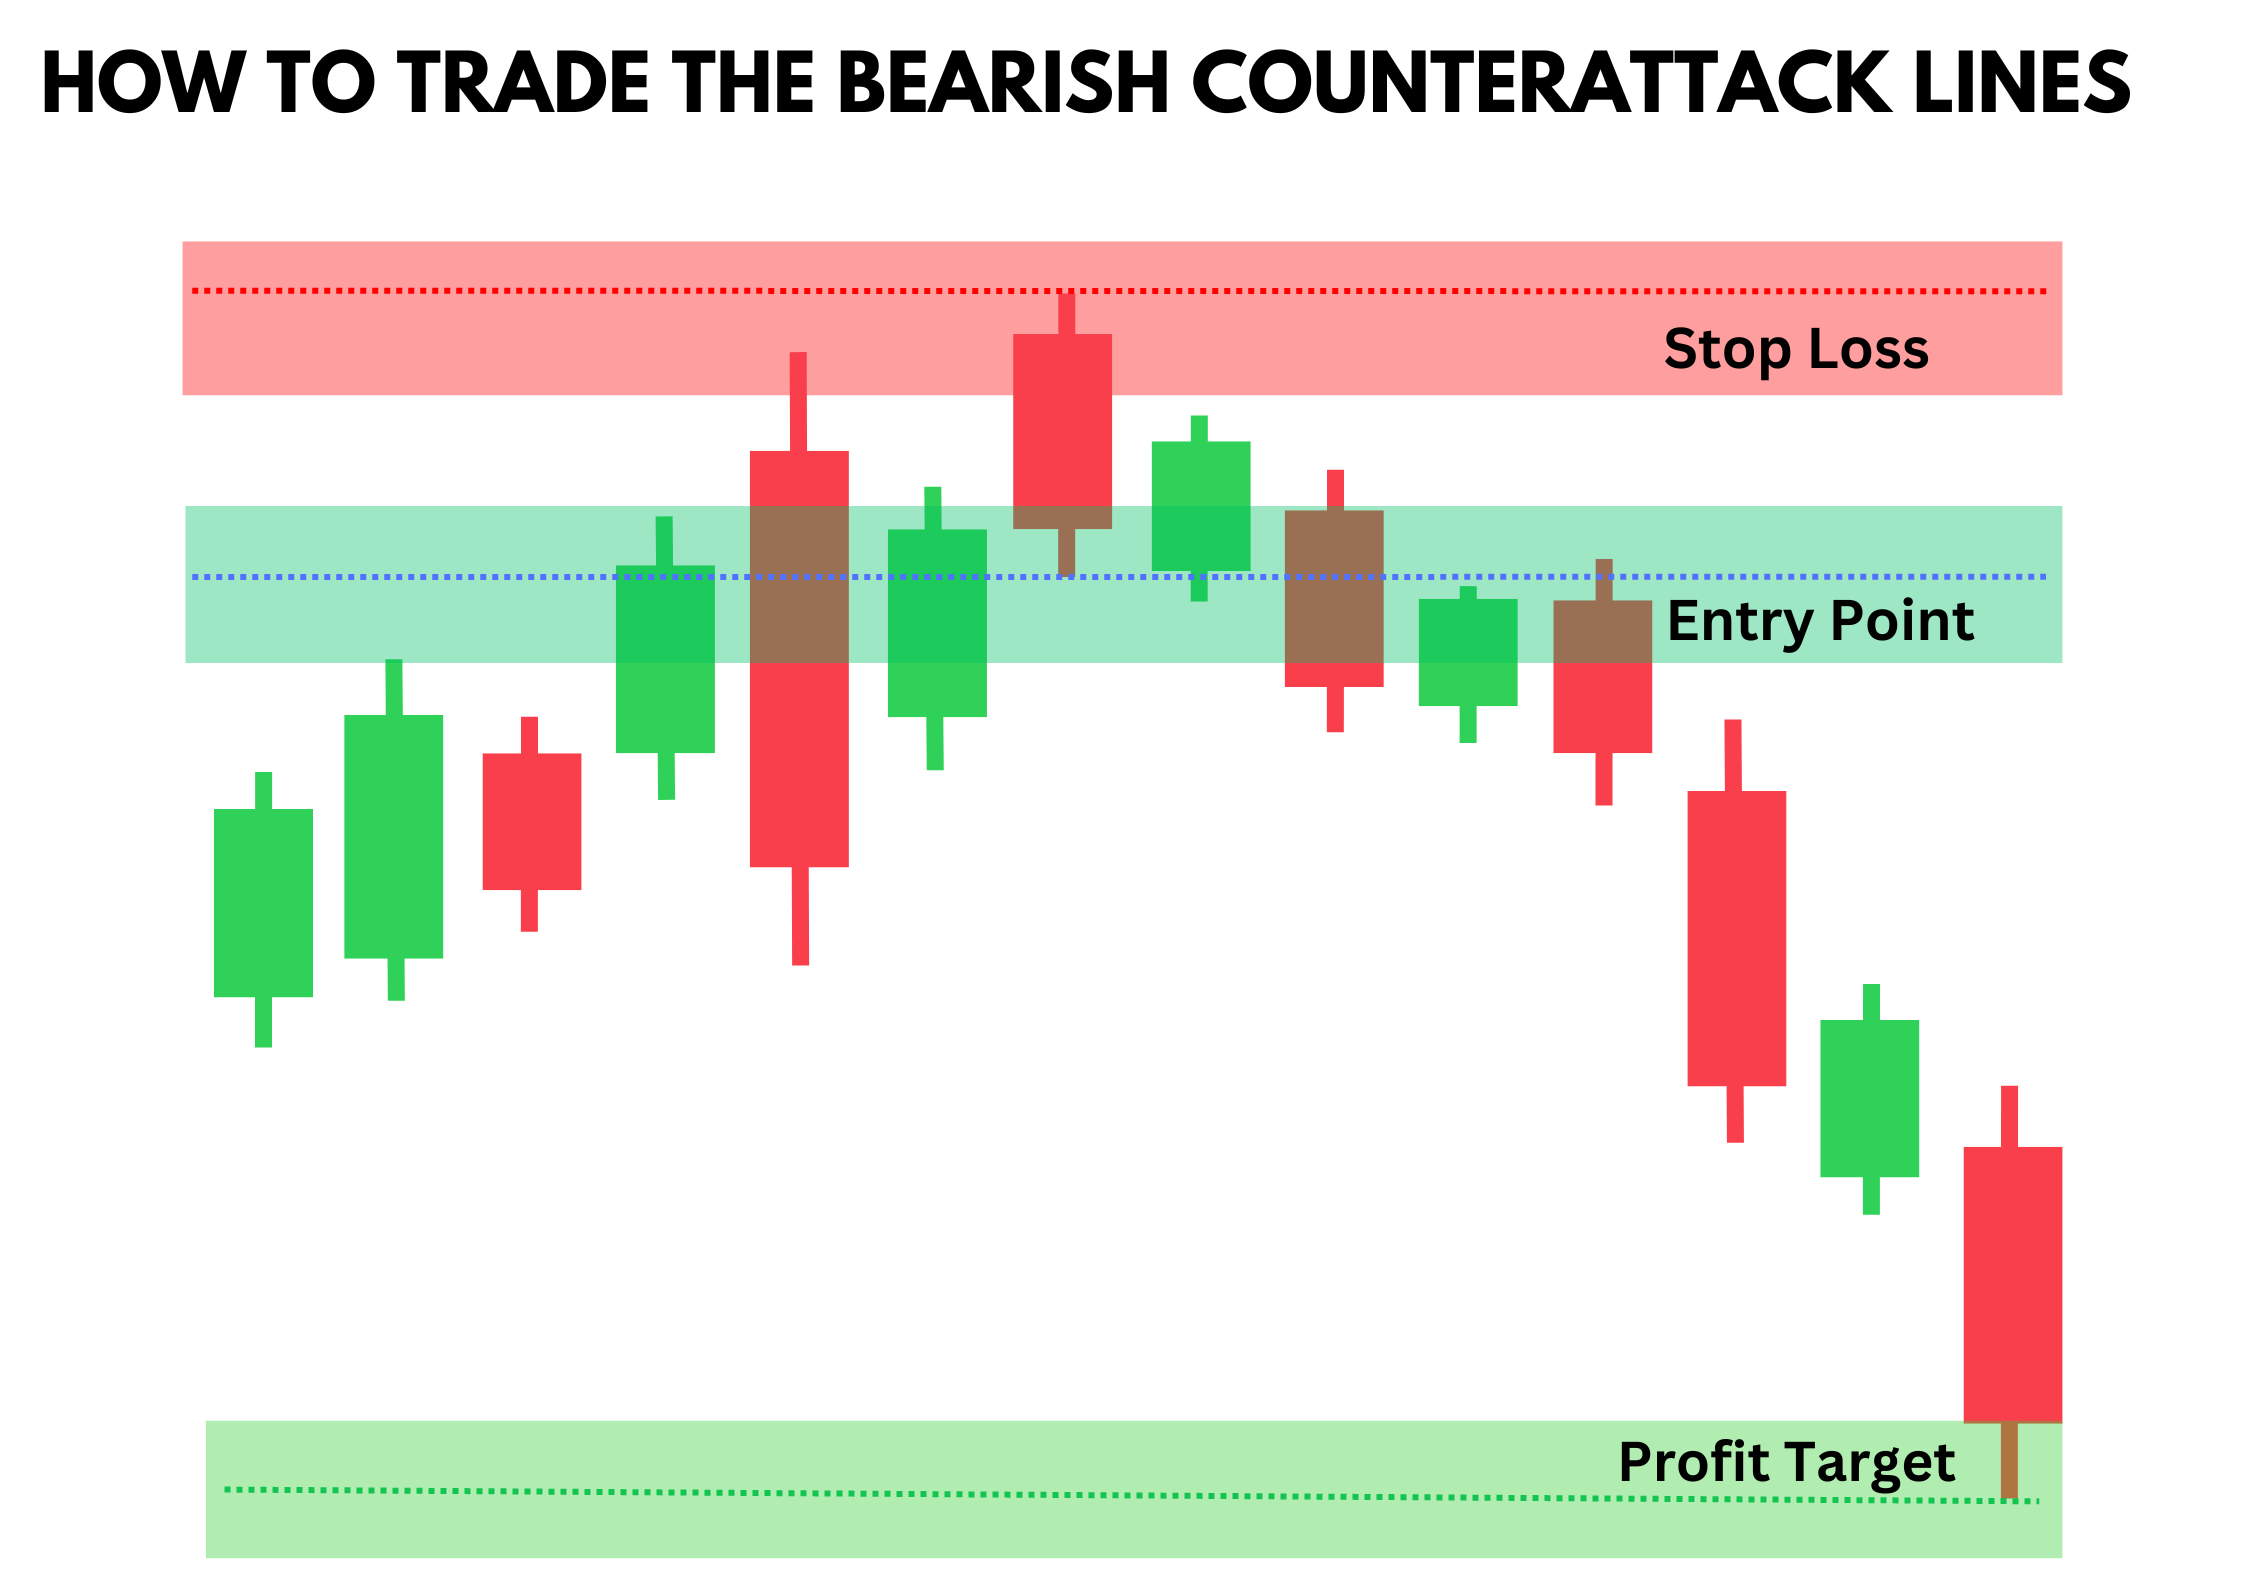
Setting a profit target is a critical component of a well-rounded trading strategy. For the bearish counterattack lines pattern, profit targets are typically determined by identifying key support levels or using a risk-reward ratio of at least 1:2. Support levels act as potential price points where the market might pause or reverse, making them ideal for setting profit targets. Additionally, monitoring price action and incorporating other technical indicators can help adjust profit targets dynamically as the trade progresses. This approach allows traders to optimize their potential gains while adapting to evolving market conditions, ensuring that they maximize profits while effectively managing risk.
Pros and Cons of the Bearish Counterattack Lines Pattern
Pros
- Provides a straightforward signal for bearish reversals
- Recognizable on candlestick charts, even for novice traders.
- Particularly reliable in strong upward trends.
Cons
- Often requires confirmation candles and other technical analysis tools to increase reliability.
- Can produce false signals in choppy or sideways markets.
- Best suited for short-term trading strategies.
Indicators to Use to Confirm the Pattern
Momentum Indicators
Momentum indicators like the Relative Strength Index (RSI) and the Moving Average Convergence Divergence (MACD) are essential tools for confirming shifts in market momentum. The RSI measures the speed and change of price movements, oscillating between 0 and 100. An RSI above 70 typically indicates that a stock is overbought, while an RSI below 30 suggests it is oversold. When the bearish counterattack lines pattern appears, a high RSI can confirm that the asset is overbought, supporting the likelihood of a bearish reversal. The MACD compares short-term and long-term momentum through the interaction of two moving averages. When the MACD line crosses below the signal line, it generates a bearish signal, further confirming the momentum shift indicated by the bearish counterattack lines pattern.
Volume
Volume analysis is another critical aspect when confirming the bearish counterattack lines pattern. An increase in trading volume on the second candle is a strong indicator that the market sentiment is shifting from bullish to bearish. High volume suggests that many traders are participating in the sell-off, reinforcing the bearish reversal signal. When the second candle closes near the previous candle's close with significantly higher volume, it indicates that the selling pressure is not only present but also substantial, lending more credibility to the potential reversal.
Trend Reversal Indicators
Trend reversal indicators like the Moving Average Convergence Divergence (MACD) provide additional confirmation for trend reversals. The MACD is a versatile tool that highlights changes in the strength, direction, momentum, and duration of a trend in a stock's price. By analyzing the relationship between two moving averages of a stock's price, the MACD can signal when a new trend, either bullish or bearish, is beginning. In the context of the bearish counterattack lines pattern, if the MACD line crosses below the signal line while the pattern forms, it strongly suggests a bearish reversal is imminent. This combined signal from both the MACD and the candlestick pattern enhances the reliability of the bearish trend reversal prediction.
Conclusion
The bearish counterattack lines pattern is a powerful tool for identifying potential bearish reversals in an upward trend. By understanding how to spot and trade this pattern effectively, traders can improve their chances of profiting from market reversals. Utilizing other confirming technical analysis tools and maintaining disciplined trading strategies are key to successfully trading the bearish counterattack lines pattern.
Also Read: How to Trade the Bearish Exhaustion Gap Pattern
FAQs
What is the difference between the bearish counterattack lines pattern and the bullish counterattack pattern?
The bearish counterattack lines pattern signals a bearish reversal in an upward trend, while the bullish counterattack pattern indicates a bullish reversal in a downward trend.
Can the bearish counterattack lines pattern be used in isolation?
While it can provide strong signals, it is best used in conjunction with other technical indicators to confirm the potential reversal.
How reliable is the bearish counterattack lines pattern in predicting trend reversals?
The pattern is relatively reliable in strong upward trends but may produce false signals in sideways or choppy markets. Using confirmation candles and additional technical analysis tools can enhance its reliability.


