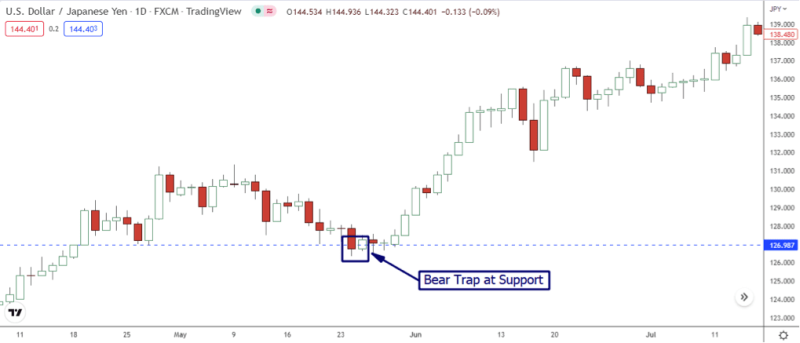
A Bear Trap occurs when shorts enter a position when stocks are down and then reverse and shoot upward. The countermovement creates traps which sometimes result in strong rallies.
Have bear traps triggered a monetary collapse in your life? The bullish trend stops abruptly, and trend reversals commence. The second is that they tell us: Let us take a break from the decline. So they are short-selling us.
Suddenly prices start jumping against you! It’s so awful! Has anyone felt this before? And that’s your bet. This trader calls this a “bear trap.” It will be helpful to learn about bear traps and avoid falling into them
The bear trap combines coordination with the controlled sale to cause an abrupt drop in the prices of a particular asset or commodity. Usually, novice trading users become caught up in price volatility when dealing with various asset classes, including cryptocurrencies.
While investors should stay afloat for years to withstand volatility, prices can be confusing even to experienced traders. Identifying warnings that prices have shifted or changed direction at a particular pace is crucial.

Also Read: The Death Cross Pattern: Technical Indicator of a Bear Market
Contents
- What is Bear Trap?
- How do Bear Traps Form During Upward Trend reversals
- Bear Traps in Price Reversal Conditions
- Bear trap example
- How does a bear trap work in crypto markets?
- Is there an indicator to anticipate bear traps
- How to tackle Bear Traps
- Bottom Line
What is Bear Trap?
Bear traps are usually common in trending stock markets. A bearish catalyst generally supported by bearish price action indicates if trend changes have occurred in the short-term, it may be triggered by the bears taking large short positions. Eventually, this trend continues, forcing many shorts to take a cover.
Short covering increases tensions for those who hold onto shorts and are normally forced to cover close to the top of a rally. The extreme bear trap is the “cult” stock in which one side of the business believes in a thesis and carries out an argument against it.
How do Bear Traps Form During Upward Trend reversals
In some market sectors, most people want to invest in stocks, but sellers are reluctant to take a chance. If a deal has been made, it could mean the buyer may offer a better price than the price the buyer wants. It may attract more sellers and increase markets because it creates a balancing effect of selling and buying.
When an investor purchases a stock, it automatically becomes an attractive target for sale. If enough customers have bought stock, it decreases the purchasing pressure and increases sales potential.
Bear Traps in Price Reversal Conditions
A bear trap pattern is a sudden price drop, which lures bullish investors into short-selling their investments, followed by a price reversal downwards. Short sellers lose money as prices rise or trigger a margin call to cover positions or sell back loans. Since bear traps are short-term patterns associated with technical trading, they cannot be used to invest long-term.
A bear trap pattern is a sudden price drop, which lures bullish investors into short-selling their investments, followed by a price reversal downwards. Short sellers lose money as prices rise or trigger a margin call to cover positions or sell back loans. Since bear traps are short-term patterns associated with technical trading, they cannot be used to invest long-term.

The initial buying phase will start when swings have reached the most recent highs because short-sighted traders have their stops a little below swing highs. The second buy comes when a strong short realizes there’s no dead cat bounce. It can cause a double bounce, usually preceded by a short-term top at countermovement.
Bears can fall into bear traps by dropping the price of commodities below their key support points. The bullish trader expects the breakdown of resistance levels following further downward movements. This made them trapped, and they lost money when prices reversed again. Bear traps cause many things.
Bear trap example
Imagine that $420, a crucial support level, was being watched by traders on the S&P 500 ETF, a proxy for the US stock market. Some traders shorted equities because they believed a breach below this support represented a bearish indication. Short sellers, however, suffered a loss when the price turned around.
Bear Trap Chart Example
Technically, a bear trap often leads to the formation of trend reversal patterns. Market participants generally use relative strength index and volume indicators to examine such price action and avoid bear traps.

In the above USD/Yen chart, most traders would consider such price breaks below the support as the beginning of a possible downward trend. However, bullish traders halted the downward movement and pushed back the price above the support level, plotting a false break pattern. Later, the price rocked north, making a substantial bullish surge and leaving bearish investors in losses.
Bear trap setup
Bear trap charts have basic setups. You will need a recent range broken down to the downside with preferably higher volumes. It will have a chance to risefiveabove support at 5 candles, then explode at its highest price point.
Last part of the setup – the stock should be in an appropriate price range. Using the wide price range increases the chance of an asset being able to continue trending to make quick profits.
How does a bear trap work in crypto markets?
Similar in mechanisms to other asset classes, a bear trap in cryptocurrencies attracts bullish and bearish bets, despite their disproportionate risks. The term bear traps in crypto markets is an attempt to manipulate markets through concerted efforts by traders who rely on the exact mechanisms. Through coordination, the collective sale of a token causes prices to fall and causes retail participants to see an upward trend.

Bear traps versus short-selling
Short-selling cryptocurrency is one of the precursors to bear traps. Similar to some asset classes, cryptocurrencies like Bitcoin (BTC) can be shorted through several different mechanisms like short-changing tokens, margin trading in Futures, or options of cryptocurrencies. These avenues can be used to rebalance positions in the Secondary market to protect their portfolio in case of market change.
Bear Trap vs. Short Sale
Generally, bear traps are short selling and short sale in the securities industry. Open short sales and bear traps are different types of business. Buying short-sell can make investors a lot of money if prices drop.
The rapid reverse of prices causes short sellers to lose money. Notification: Short selling or “selling short” a person who has purchased shares or units of investment securities, usually through a brokerage, buys the stakes with the intent of falling. An investor can purchase shares for lower prices and make more.
Bear Trap vs. Bull Trap
A bear and a bull trap are similar because both involve a false signal which indicates an end to the trend followed by a reversal which returns to its original trend. In either instance, investors incur short-term losses. Where bear strap and bull trap differ is that the trend reverses are opposite.
Also Read: Bull Trap: What does it do?
Is there an indicator to anticipate bear traps
Any trader could suffer huge losses due to a bear trap. It’s better to be aware of what to look out for before you fall victim to the trap in order to reduce this type of danger when trading. Additional technical signs to keep an eye out for include:
- Fibonacci Levels: Since trend reversals are detected using Fibo ratios, Fibonacci levels signal price reversals in the market. It makes them excellent bear trap indicators. When the trend or price doesn’t breach any Fibonacci levels, a bear trap is most likely to develop.
- Market Volume: The market volume is considered a key indicator for determining bear trap setups. When a price is possibly increasing or decreasing, the market volume changes significantly. However, a price drop is probably a trap if there isn’t a noticeable rise in volume. Due to bears’ inability to persistently drive the price lower, low volumes frequently signify a bear trap.
- Divergence: Divergence signals are provided by specific indicators. There is a bear trap when there is divergence. If the indicator and the market price go in opposite or divergent directions, that is a sign of divergence. When the price and indication move in the same direction, there is no divergence. Hence a bear trap won’t happen, according to this method of predicting when one will happen.
How to tackle Bear Traps

Don’t shorten into Upside Momentum
Market conditions can vary from range growth to range contraction. Most stocks have an extended range of range contraction but rarely do much, almost exclusively. Bear traps occur at the end of the range extension spectrum and at the forecast’s lowest time.
When the market’s range expands, one side usually controls the entire trading system. Typically it is quite easily visible. In recent days the Real Estate Asset Managers Association of New Zealand St Joe (JOE) had begun a major range extension phase following long periods of range contractions. “I can say the bulls are controlling the situation. Rallyes and contested battles are strong, and the drawbacks are shallow and cautious,” he stated.
Focus on the big picture – the technical patterns
Trade traps have several reasons. They have hardly disciplined risk managers. They are victims of loss aversion fallacies. And they often overlook technical features that suggest they may find themselves trapped. Give me an example of parabolic low floating stocks.
Natural Shrimp is one of the largest OTC Aquatech firms which uses an innovative production method to produce good shrimp. This is commonly believed to mean shorting the first red day for stocks like this. This theory explains why companies fold under pressure from insiders and emails.
Practice disciplined risk management
Traders need to protect themselves by minimizing risk. If you plan and manage long positions in the order of trade size to stop losses and risk, a day trading trap can cripple you. If we click the “sell Short” button on our brokerage platform, it’s all right to plan.
Aside from the stop loss, the risk of day trading must be rationalized per lousy trade. Even the best traders rarely get more than 60% wins, so it should be no surprise that the losses occur. In this way, you must have a rational risk per trade, measured in percentages.
Bottom Line
We all fall victim to trade traps. We can believe we have something the market as a whole lacks, only to have the market turn the tables on us. Nobody can always avoid this outcome. Thus, there is no reason to be humiliated. The difference is in how we respond when caught in a rapid trade. We still have choices over how to respond even when the stock gaps up and skips our stop loss. Either we may swiftly abandon the trade after admitting we made a mistake and nurse our wounds, or we can try to gamble with the future of our funds by “trading around” our position.


