The bear pennant is a continuation pattern because it is a bearish chart pattern that seeks to prolong the downtrend. It functions similarly to a bull flag, except that it is a bearish pattern seeking to drive the market action even lower following the consolidation period.
In contrast to the flag chart pattern, which employs two parallel lines for consolidation until the breakout, the pennant uses two convergent lines.
Also Read: Is Shiba Inu Whale The Future Of Cryptocurrency?
Contents
- What Is A Bear Pennant?
- How To Identify the Bear Pennant Pattern
- Bearish Pennant Formation
- Spotting The Bear Pennant
- How To Trade Using Bear Pennant Chart Pattern
- Bearish Pennant Pattern Vs. Bullish Pennant Pattern
- Bear Pennant Vs. Bear Flag
- Restrictions Of the Bear Pennant Pattern
- Bottom Line
- FAQs
What Is A Bear Pennant?
The bear pennant comprises two phases: an intense downturn and a consolidation phase after the downtrend. The former begins when sellers force a sequence of lower highs and lower lows into the price action.

Once the sellers have established the short-term low, the second phase starts. The triangle consolidation, in which the price action oscillates between the two convergent lines, distinguishes this brief pause. Like the bear flag, the consolidation phase requires a downturn; otherwise, it would be a regular triangle.
How To Identify the Bear Pennant Pattern
Consider consolidation between support and resistance after a large bearish price move when looking for a bear pennant pattern. Support and resistance lines combine to form a nearly symmetrical triangle, suggesting that the market is conflicted between positive and negative sentiment.
To recognize the bear pennant, follow the steps below:
- Recognize a price decline trend.
- Pull the flagpole out.
- Recognize a following moment of market consolidation.
- On the top and lower boundaries, draw trendlines.
Draw the Flag Pole
A series of decreasing periodic lows and highs characterizes a price downtrend. The flag pole for the bearish pennant represents the bearish trend. Once found, a trendline may be created to help put price action into context.
Bearish Pennant Formation
A bearish pennant is a continuation pattern when there is a significant downtrend, and the price action begins to consolidate in a condensed trading range.
It is possible to create a chart pattern resembling a triangle flag on a pole by drawing two converging trendlines connecting the consolidation’s highs and lows.

The market’s breakout direction is determined by whether values break the resistance or resistance level first along the two trend lines, which serve as support and resistance levels.
This chart pattern is quite bearish since traders are unwilling to catch a falling knife due to the general pessimism in the market.
After a downward breakout occurs, it typically denotes the continuation of the current slump.
The formation is complete when the price movement breaks below the bearish pennant’s bottom trend line.
After the bears have taken control of the market sentiment, the breakthrough frequently coincides with intense selling pressure (volume).
You should note that when the consolidation stage lasts between two and three weeks, the pattern is the most dependable.
More time than that results in a symmetrical triangle rather than a pennant. This indicates that when the support and resistance level is breached, it may break out in either direction.
Also Read: What Is Ospreyfx? – Ospreyfx Review
Spotting The Bear Pennant
The decline must first be located. The breakout is the third and last step before we potentially enter the market. The second step is the consolidation period, which should resemble a pennant.
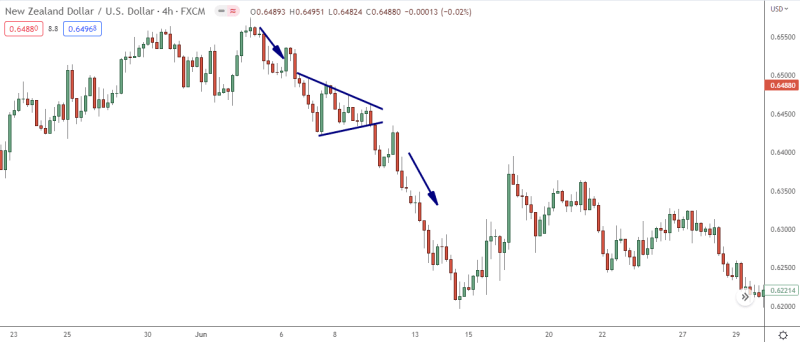
The sellers are in charge as the price movement moves downward, as shown in the NZD/USD 4H chart below. NZD/USD had been trading near its highs before the decline, with two failed efforts to break over the horizontal resistance at the chart’s top.
Due to this failure, a decline in the price action with a string of lower lows and lower highs was initiated. The price action bounced back at the levels of the previous swing low, the horizontal support, after the conclusion of the initial move lower (the flagpole).

The buyers push the price action from the lows to begin the consolidation phase. The sellers reclaim control of the market movement and aggressively drive it below the bearish pennant after three consecutive lower highs and failures to continue the bounce. As a result, the breakout is assured, and we can now define the trading setup.
How To Trade Using Bear Pennant Chart Pattern
Trading bearish pennant patterns involve a technique just like trading other chart patterns. Determining market entrance, setting the stop-loss, and assigning a profit objective are the three easy steps in the procedure.
Market Entry
The bearish pennant pattern indicates that the market is under downward pressure. So, entering the market on the short side makes sense. Under the bottom trend line of the pennant, set a sell market or sell stop-limit/market order to enter the market.
After the sale is completed, a new short position is created.
Stop Loss
Stop losses for trading the bear pennant pattern is simple to find. Set the stop loss above the pennant’s upper trend line.
Keep in mind that margin is used while buying and selling currency pairs. Furthermore, the margin is a big risk. Stop losses are therefore strongly advised in your forex trading tactics.
Profit Target
The bear pennant chart pattern indicates that the market should be shorted. Therefore, profit targets will be below the pennant’s lower trend line.
The risk/reward ratios are frequently used to align profit targets. The profit objective, however, will always be below the bearish pennant on your price chart, regardless of how you set it.
Bearish Pennant Pattern Vs. Bullish Pennant Pattern
Price action that rallies then trades sideways in a constricting range before continuing the dominant uptrend forms a bull pennant pattern.
The continuation patterns are known as the bullish and bearish pennants. Both signal a halt in the market’s current trend.

The key variations between these two structures are as follows:
First, whereas the bearish pennant pattern appears during a downtrend, the bullish one does so during a strong uptrend
Second, the triangle portion of the formation typically slopes upward in a bearish pennant pattern, whereas it gently slopes downward or appears flat in a bullish pennant pattern.
Finally, the leading trend dictates the path of a breakthrough. As a result, the bearish pattern usually breaks out to the downside, while the bullish one does so to the upside.
Bear Pennant Vs. Bear Flag
You can see that these two patterns share many traits, but when depicted on a chart, they appear slightly different.
Prices consolidate between two convergent trend lines, forming a little triangular flag with a modest upward slope and a bear pennant stock pattern.
On the other hand, two up-sloping horizontal trendlines that form a rectangular flag often make a bear flag pattern.
The breakout direction and profit objectives of the bearish flags and pennants are very similar, and they both form a down-trending market.
Restrictions Of the Bear Pennant Pattern
An excellent pennant can alert you to a strong trend with a transaction that has a favorable risk-to-reward ratio. Not all emerging pennants, though, are entirely accurate.
The likelihood of a continuation lower decreases if the triangle consolidation phase lasts longer. This enhances the possibility of a complete reversal, which may aggravate bearish traders.

Instead of trying to time a short sell entry at the triangle’s high, one approach to avoid this irritation is to wait for a breakdown below the triangle’s lows.
The data pouring in from other corroborating indicators may be inaccurate if you follow the bear pennant pattern on a minute chart, which is another drawback. The volume or ATR indicator doesn’t receive enough data to generate clear signals. Therefore, even if the pattern eventually plays out, a smaller chart period might not indicate confirmation of the pattern.
Bottom Line
The Bear Pennant pattern is a technical analysis pattern that appears in a downtrend and signals a continuation of the existing trend. It consists of a small-bodied candle with a long wick at the bottom. This is followed by consolidation, which forms a pennant pattern. The breakout of the pennant signals a continuation of the downtrend and provides an excellent opportunity for traders to go short.
Regarding risk management, stop-loss orders should be placed just above the high of the pennant. This ensures that, if the trend reverses, traders will not suffer any significant losses. Ultimately, the bearish pennant is a reliable signal for traders looking for opportunities to go short.
FAQs
What is a Bear Pennant?
The bearish penny indicates an upcoming continuation of the downward trend in prices in the stock market. Instead of consolidating after an ascending move, the market stops on a major downward movement.
How do You Trade a Bear Pennant?
The strategy of pennant: In bearish patterns, you should place sell-stop trade slightly below the lower sides. In such an instance, a trade stop will be triggered. Initial profits should be lower on the pennant hoist.
Can Bear Pennant Break Up?
The second is that it is clear where the pennant can break. Its reversal follows a previous direction that will lead to a downward trend when backed up by a bearish penny. The standard triangle may have the breakout on either side.


