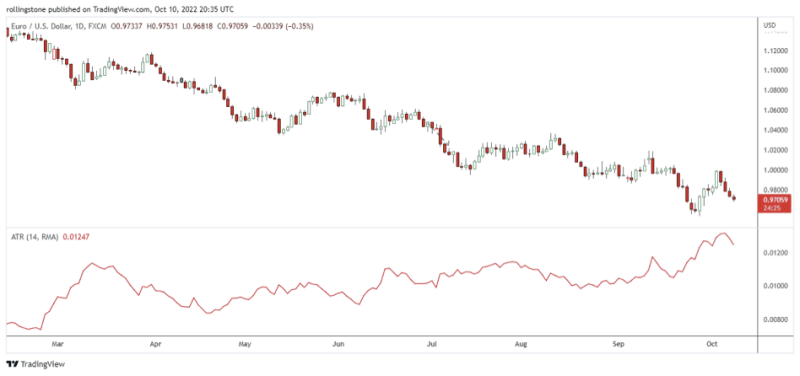
The Average True Range (ATR) is a technical indicator widely used by professional traders for measuring market volatility. In his book “New principles in technical trading systems,” Welles Wilder introduced it. Since then, this indicator has been included in a wide variety of other indicators and trade deals.
After an extreme price decline brought on by panic selling, the Average True Range frequently reaches a high figure at the bottom of the market. Low levels of the indicator are typical, with long-lasting sideways movements that occur at the market's peak and during consolidation. Similar rules apply to how the Average True Range(ATR) should be interpreted as with other volatility indicators.
The idea behind this indicator-based forecasting is that the probability of a trend change increases with an increasing indicator value, and decreases in indicator value indicate weaker trend movement.
Also Read: ATR Indicator: How and what it means
Contents
- What is the Average True Range (ATR)?
- How does the Average True Range (ATR) Indicator Work?
- The Calculation Process of Average True Range Indicator
- How does Average True Range Work?
- How does Average True Range Measures Price Volatility?
- Bottom Line
- FAQs
What is the Average True Range (ATR)?
Average True Ranges are technical indicators that measure market volatility. It explains how volatility occurs during price changes, determines the best trade period, and achieves a consistent trade.
Wilder first developed the ATR for commodities, but the indices may be used as stock and index indicators. A stock with high volatility has a higher ATR, and a low volatility stock has a lower ATR.
Professional experts may use the ATR for entering or exiting trades as an essential tool in trading systems. This tool allows traders to measure daily volatility in assets using simple calculations. These indicators are used primarily to assess the volatility caused by price gaps and limit up and lower movements.
How does the Average True Range (ATR) Indicator Work?
Average True Range indicator software provides predictions about trend changes through the current ATR and reveals volatility. ATR values can be boosted by higher volatility and high value of trend changes.
In addition, lower ATRs imply higher volatility. It provides a signal for a sideways market. An indicator is otherwise difficult to determine without indicators such as Directional Movement indices ADX or Directional movement indicators (DMI).
The Calculation Process of Average True Range Indicator
Trade brokers are allowed to create buy and sell signals in less than fourteen days, while longer periods generate a greater probability of creating fewer trading signals. An example is how an experienced investor can analyze the stock volatility over five trading day periods.

Therefore traders will be able to calculate a 5-hour ATR. Assuming historical prices have been organized in reverse chronological order, the trader can get the maximum value of the current highs and lowest, the absolute value of the current highs and the previous closes, and the absolute value of the current lows and previous closes.
The ATR calculation requires discovering the True Range. True Range includes current period high low and previous period close (if necessary). This calculation is done three times to compare the results and compare them.
It's also essential to avoid negative numbering as well Once you have the True Range, the Average True Range is displayed. Take ATR as a moving average for the True Range.
Also Read: ATR Indicator Ultimate Guide
How does Average True Range Work?
Traders should know how their favorite indication is generated to make the best trading decisions. We'll show you how to compute the ATR indicator without getting too deep into math calculations.

The ATR gauges the average price movement of the market. Depending on how the candles are plotted, it is commonly calculated using one of three techniques of calculating the True Range (TR) values:
- Procedure 1: A current high and low is utilized when the current candle's Range exceeds the previous candle's Range.
- Procedure 2: current period high minus prior close (Absolute value). Whenever the current candle ends above the previous candle, it is used.
- Procedure 3: current period low minus prior close (Absolute value). This symbol is utilized when the present candle closes below the previous candle.
As a result, we can conclude that the longer the candle range, the higher the value of the ATR.
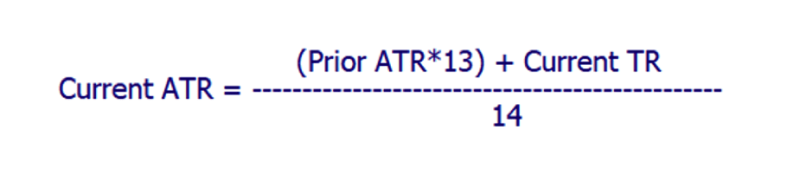
The Average True Range (ATR) is often determined on a 14-period basis and can be calculated intraday, daily, weekly, or monthly. The first true range value is determined as the high minus the low to establish the beginning.
The ATR with a 14-day period value is the average of the last 14 days' daily true range values. The formula for the ATR is as follows:
How does Average True Range Measures Price Volatility?
The difference between the market's highs and lows outlines the daily price range. It provides details on a stock's volatility. Small ranges denote minimal volatility, while large ranges denote high volatility. Commodities and options are measured using the same formula (high minus low) as stocks.
A rising ATR indicates an increase in price volatility. An increase in ATR would show the strength of a price reversal. ATR is not directional.

Therefore, an expanding ATR could indicate either selling pressure or buying pressure. High ATR readings often follow a sharp rise or slump and are not expected to persist for very long.
The prolonged sideways measure price direction that produces decreasing ATR readings indicates lower volatility. Long-term low ATR levels may indicate consolidation and the likelihood that a move or reversal will persist.
When a stock or commodity exceeds a constrained range, it will likely keep moving in that direction for a while. Opening gaps have the drawback of masking volatility when seen in the daily Range.
A commodity's Range will be minimal if it opens the limit up, and adding this small value to the open the following day will probably result in frequent trading.
After a limit move, volatility is likely to decline. Thus, this is an excellent opportunity for traders to search for markets with better trading chances.

Bottom Line
ATR is a special volatility indicator that indicates the level of interest or indifference in a move rather than a directional indicator like MACD or RSI. Huge ranges, or large True Ranges, frequently accompany strong moves in either direction. This is especially true when moving forward.
Uninspiring moves may accompany narrow ranges. ATR can therefore be utilized to confirm the enthusiasm for a move or breakout. An increase in ATR would indicate significant buying pressure and support a bullish reversal. A rise in ATR and a bearish support break would indicate intense selling pressure and strengthen the support break.
FAQs
What does the average true Range tell you?
The average Range is a volatility indicator that indicates how many assets are moving in varying amounts over a specified period. The indicators may help traders decide when to initiate trading or determine when to put orders.
What is the average true range formula?
The ATR formula: [(ATR xn-1) + (currently TR)/n. – TR = – max. (lowest, ABSH (highest before closed) In general, ATR value is calculated at intervals of 14 days.
What is a high ATR?
A stock with high volatility is likely to be more volatile, and a low-volatility stock will have lower volatility. It can be used by market engineers in entering and exiting transactions.
How do you read ATR values?
A high ATR signifies higher volatility, and a lower ATR indicates low volatility. Nevertheless, remember that ATR doesn't indicate the possible trend orientation but only indicates what's going on in terms of price volatility.