The Average Directional Index (ADX), Negative Directional Indicator (-DI), and Positive Directional Indicator (+DI) are a set of directional movement indicators used in Welles Wilder's trading technique. Although Wilder's Directional Movement System was created with commodities and daily prices in mind, stocks can also benefit from similar indicators.
The Directional Movement System's foundation comprises positive and negative directional movement. Wilder was able to establish the direction of motion between two consecutive lows with the difference between their corresponding highs.
These disparities' smoothed averages are used to create the Positive Directional Indicator (+DI) and Negative Directional Indicator (-DI), which measure the direction of the trend over time. The Directional Movement Indicator refers to these two indicators taken together (DMI).
The Average Directional Index (ADX), which gauges the trend's strength (independent of direction) across time, is, in turn, generated from the smoothed averages of the difference between the +DI and -DI.
By combining these three signs, chartists can assess the trend's direction and intensity.
Also Read: What is Strategy Tester?
Contents
- How Does Average Directional Index Work?
- Calculation Of the ADX Indicator
- What Does The Average Directional Index Tell You?
- Using ADX Indicator in Trading
- How To Interpret the Positive Directional Indicator (+DI)
- How To Interpret the Negative Directional Indicator (-DI)
- The Stochastic Oscillator's Benefits and Drawbacks
- Bottom Line
- FAQs
How Does Average Directional Index Work?
The average Directional Index, or ADX, is a trading indicator used to gauge the general market trends' strength. Eliminating many unneeded and lost transactions is frequently used as a filter to improve an existing trading strategy.
ADX, not the trend direction, displays only the trend strength.
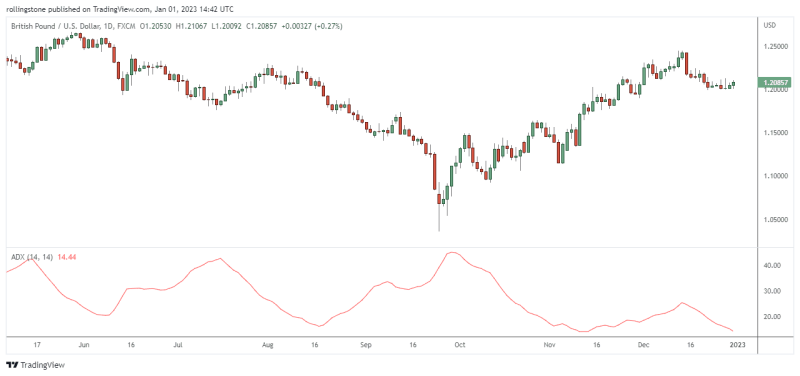
According to conventional wisdom, ADX readings above 25 indicate a significant trend, while those below 15 indicate a stable market that is not currently trending. We may then use mean reversion or trend-following methods based on the ADX level.

For instance, we may only want to go long on a new breakout if ADX displays high ADX values, which denotes a solid and healthy trend.
The length of the ADX now dramatically affects what is regarded as a high or low reading. As you'll discover later, if you use a length setting that is short enough, ADX readings could very well reach 70 or 80. However, the threshold numbers just mentioned (below 15 for calm markets and over 25 for moving markets), which are the default duration for the ADX, tend to work fairly well!
Calculation Of the ADX Indicator
The difference between two successive lows and their respective highs are compared to determine the direction of movement.
When the previous high minus the present high is greater than the previous low minus the current low, there is positive (plus) directional movement. If positive, this so-called Plus Directional Movement (+DM) equals the most recent high minus the previous one. If the ADX value were negative, it would be entered as zero.
When the current low minus the preceding low is larger than the recent high minus the prior high, directional movement is negative (minus). If the prior low were positive, the present low would equal the prior low minus this so-called Minus Directional Movement (-DM). If the ADX value were negative, it would be reported as zero.
Four instances of directional movement calculations are shown in the chart above. The first pairing has a solid Plus Directional Movement (+DM) by a significant positive difference between the highs. In the second pair, Minus Directional Movement (-DM) is more prominent and depicts a day outside. A significant disparity between the lows for a strong Minus Directional Movement may be seen in the third pairing (-DM).
The final pair depicts an inside day with no directional change (zero). Together, Minus Directional Movement (-DM) and Directional Movement (+DM) cancel each other out because they are both negative and eventually return to zero. There will be no direction change on any days that are indoors.
What Does The Average Directional Index Tell You?
Momentum indicators include the ADX, the negative directional indicator (-DI), and the positive directional indicator (+DI). Investors can evaluate trend strength using the ADX, and trend direction using the –DI and +DI.
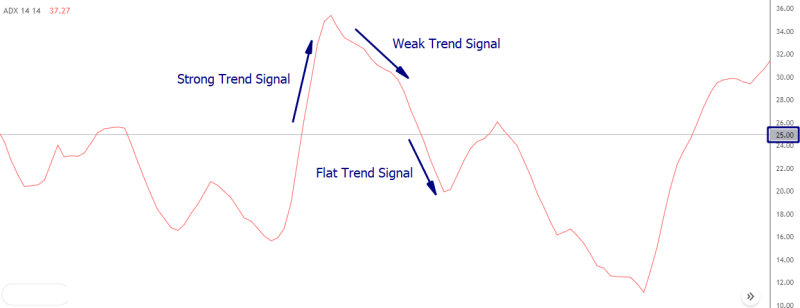
The ADX value hits above 25 during a strong trend and moves below 20 when the trend turns weak. The +DI and –DI lines can produce precise trading signals. Enter long when the +DI exceeds the -DI and ADX value reaching above 25.
Conversely, the –DI line crosses over the +DI level with ADX above 25 will be considered as a short entry signal. Such crossovers can also be used to close out open positions.
For example, if you’re holding an open buy position, you may lock the profit once the –DI moves above +DI. The ADX value reaching below 20 indicates the price is not is a steady trend condition and we should avoid placing fresh orders during such periods.
Using ADX Indicator in Trading
Indicators like the Average Directional Movement Index can be quite helpful while trading. If you notice a breakout in stock, you can go long or short on it.
As an alternative, you can use the indicator to determine whether or not the stock price would keep moving in the same direction. If not, you can buy or sell in order to increase profits and decrease losses.

For instance, the trend wanes if the ADX indicator drops below 50. It would be best if you closed any open trades at this time to limit losses.
Another technical indicator, such as the ADX indicator, can be used to ascertain if the trend is upward or downward.
Also Read: How To Read Candlesticks Like A Pro
How To Interpret the Positive Directional Indicator (+DI)
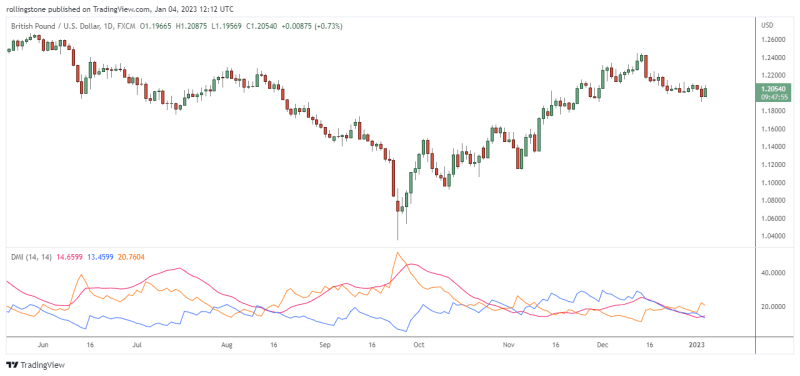
Traders frequently follow the +DI against the -DI position. A bullish trend is said to exist when +DI exceeds -DI. Thus, the potential for a fresh price rise is indicated when +DI crosses over -DI.
The price is in a negative trend when -DI is higher than +DI. When -DI crosses above +DI, it can indicate the beginning of a downward price trend. The Directional Movement Index is the sum of the +DI and -DI (DMI).
ADX indicates a trend's strength. According to Wilder, when the Average Directional Index is higher than 20, and especially 25, a significant trend can be seen.
All the lines can be utilized together in this manner. Long trades should be preferred once the ADX value reaches above 20 and the +DI crosses over the -DI. Short trades should be preferred when the ADX value exceeds 20 with the -DI crossing over the +DI.
How To Interpret the Negative Directional Indicator (-DI)
Together with the +DI line, the -DI line aids in illuminating the trend's direction.
When the -DI is higher than the +DI, the trend is negative, or at least the recent downward movement has outpaced the current upward move. If +DI is higher than -DI, the trend is upward or lately occurring. The bullish price movement has outpaced the current downward price movement.
Crossovers between these two lines are commonly utilized as trading signals since they might show trend direction. Indicating a price move down, the -DI crosses above the +DI is a sell or short trade indication. A purchase signal is generated if the +DI crosses over the -DI.
The Average Directional Movement Index (ADX) system includes several indices. Traders can better assess the strength of the present trend by adding the ADX line, which is a smoothed average of the difference between the +DI and -DI. The ADX often indicates a significant trend is present when it is over 20, especially when it reads above 25.
Traders can use all the components of the ADX method to aid in better trading decisions. For instance, the +DI and -DI lines display the trend direction and crossovers. A trader may elect only to enter long trades when the ADX is above 20, and the +DI is above or crosses the -DI, indicating trend strength.
The Stochastic Oscillator's Benefits and Drawbacks
Like most other technical analysis tools, the average directional index has distinct benefits and drawbacks. To make the most of its use, it is essential to comprehend where this trend indicator succeeds and where it falls short.

Benefits of ADX Indicator
- An excellent method for determining the strength of a trend;
- Alerts indicating variations in trend momentum;
- Useful for identifying the most potent trends;
- Excellent in identifying trending circumstances in a range of instruments, including FX and stocks;
- It can be used to confirm the legitimacy of a trend breakout.
- The indicator is useful for swing trading as well as day trading;
Drawbacks of ADX Indicator
ADX is a price-following lagging indicator;
When applied to shorter durations, it can provide a lot of false signals;
It is encouraged to use it in conjunction with other indicators because it lacks some of the information required for a complete price action analysis.
Bottom Line
The Directional Movement System indication calculations are complex, but understanding how to interpret them is simple. Given how frequently +DI and -DI crosses occur, chartists must use complementary analysis to filter these signals. Setting an ADX criterion will reduce the number of signals, but this ultra-smooth indication tends to filter out as many positive signals as negative ones. To put it another way, chartists may want to put ADX on the back burner and concentrate on the Directional Movement Indicators (+DI and -DI) for signal generation.
The crossover signals produced will resemble those produced by momentum oscillators. Therefore, chartists must go elsewhere for assistance with confirmation. Strong crossover signals versus weak ones can be distinguished using volume-based indicators, fundamental trend analysis, and chart patterns. Chartists can concentrate on +DI buy indications, for instance, when the larger trend is upward, and -DI sell signals when the larger trend is downward.
FAQs
What is a Good Average Directional Index?
Strong trends are indicated by the ADX readings above 25, while weak trends are indicated by readings below 20. Signals for trading can be produced by the -DI and +DI lines crossing. A potential purchase signal, for instance, would be present if the +DI line crossed the -DI line and the ADX was over 20, ideally above 25.
How is the Average Directional Index Calculated?
The ADX indicator is 100 times the exponential moving average of (+DI minus -DI) divided by (+DI plus -DI). The ADX shows market momentum, direction, and whether a trend is present. The +DI and -DI levels define the direction of the market.
What are ATR and ADX?
The ATR indicator is located in the daily Gold charts. The ADX indicates a strong Trends indicator, while the ATR indicates Volatilities.


