How to Use the ATR Indicator
Rookie traders often have an interesting story to share of how smooth their entry was into a particular market. The problem is that most of them don’t know how to get out at the right time. What tends to happen next is huge losses. Given how frequently this occurs in conversations, people create the number 1 rule of trading. That is to control your risk. Of course, this is easier said than done. You can recover from small losses quickly, but it feels like being punched in your gut when you are looking at massive losses. Thankfully, there are a few ways to help you manage your risks. One of the tools we will discuss today is the ATR indicator.
Contents
- The Best ATR Indicator
- What is ATR Indicator MT4?
- The ATR Indicator Calculation
- How to Use ATR Indicator?
- The ATR Indicator Exit Strategy
- How to Use the ATR Indicator for Stop Loss
- The ATR Stop Loss Calculator
- Conclusion
The Best ATR Indicator
First and foremost, you should use the ATR indicator built into Meta Trader 4, or MT4. This is an incredibly popular trading platform among forex traders. Unfortunately, the ATR indicator for MT5 has not been developed yet.
What is ATR Indicator MT4?
The ATR indicator, or average true range indicator, measures market volatility. It was created by J. Welles Wilder Jr. a market technician, who wrote the book titled “New Concepts in Technical Trading Systems.” Originally, ATR is supposed to be used in the commodities market, but it has many applications in all types of securities such as forex trading.
As the name suggests, the ATR indicator looks at the average of true ranges over a period of time. The true range uses 3 elements: the current high minus the current low, the current high minus the previous close, and the current low minus the previous close. The three values must be absolute values, aka positive values. Whichever value is the highest is the true average for that time period.
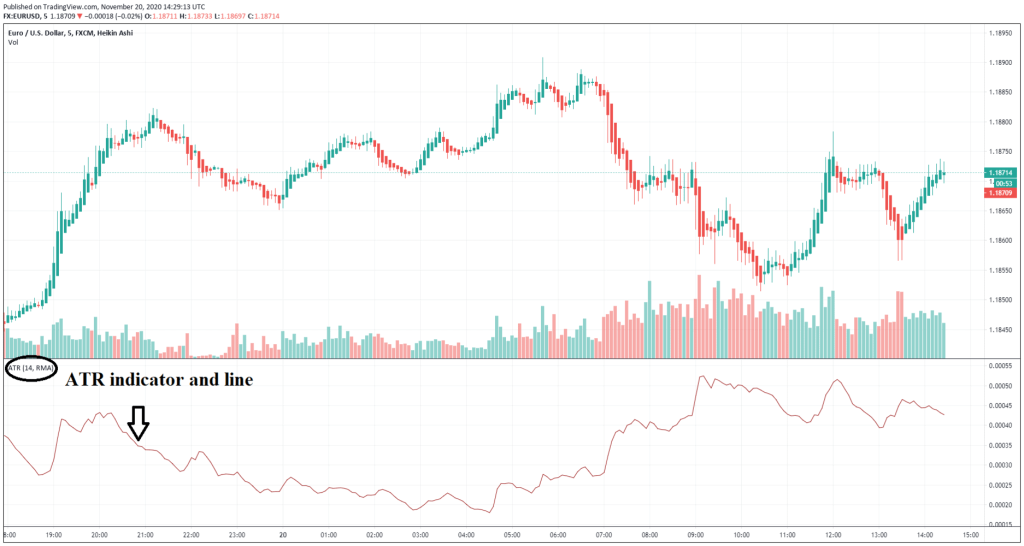
ATR’s value corresponds to the market’s volatility, making it an excellent tool to measure a market’s volatility. You only need historical price data and simple calculations to do this. Higher volatility has higher ATR and lower volatility has lower ATR. It helps traders determine when to enter and exit trades.
As with all other tools, you need to use the ATR alongside other indicators to help you make trade decisions. The ATR alone does not provide enough vital information such as the price direction which can be analyzed through price action trading. You can use ATR to position sizing based on your risk tolerance, risk reward ratio as well as the market’s volatility.

That said, there are 2 main limitations for the ATR. For one, the ATR is subjective, meaning that the numbers it gives you are up to interpretation. Different traders see the values differently. An ATR value alone does not tell you whether a market trend is about to reverse or not. So, use the ATR with other indicators such as Bollinger Bands Forex, Trendline Trading, Support and Resistance Forex, while also studying the market’s history to see its strength or weakness.
In addition, the ATR only indicates the market’s volatility, not the direction of the price. This can produce mixed signals, especially when the market is at a turning point. So, you may think that the market is following an old trend based on the ATR readings when it is not.
Traders generally use the ATR to determine their exit point, regardless of their entry strategy. However, you can use the ATR to identify both entry and exit points. We will talk about these forex trading strategies later.
The ATR Indicator Calculation
Normally, traders use periods of 14 days to calculate the ATR. The downside is that this method does not generate many trading signals. The shorter the period, the more trading signals you get.
For instance, suppose that you are a short-term trader who wants to look at the volatility of a market over a period of 4 days. So, you can just calculate the 4-day ATR. If you arrange the historical price data in reverse chronological order, you can see the maximum of the values of the 3 elements: the current high minus the current low, the current high minus the close of the last period, or the close of the last period minus the current low. Whichever value among the three is highest is the true range for that day. Rinse and repeat for the other days. With the values of the true range for all 4 days, you add them all together and divide by the number of days. In this case, you divide by 4. This is your average true range for those 4 days.
Here’s an example. Suppose that the true range of the 4 days are: 1.25, 1.5, 2.0, and 1.25. So, TR1 = 1.25, TR2 = 1.5, TR3 = 2, and TR4 = 1.25. Using the formula:

With n being the number of days. With the example above, we would have something like this:

Now, suppose that the ATR of the first 4 days is 1.25 and the 5th day has a true range of 1.15. You don’t have to repeat the above formula again to calculate the subsequent ATR value of the next day. Instead, you just take the previous value of the ATR (1.25) and multiply it by the number of days minus 1 (5-1), add the true range for the current period (5th day, 1.15), and divide by the number of days (5).
The formula is:
![]()
With ATRt being the ATR of the current period, ATR(t-1) being the ATR of the previous period, TRt being the true range of the current period, and n being the number of days. Using the example above, we have:
![]()
How to Use ATR Indicator?
The number alone does not tell much. It starts to make a little more sense when you compare the ATR of the current period to the previous one. If the value is increasing, then that could mean that the market is increasing in volatility. Since ATR does not indicate the market’s direction, the increase in value could also indicate a long buy or a short sale.
Also, if the market experiences a sharp decline or a spike in prices, the ATR value increases, although this might not be the case for long.
If the ATR value is low, that means the prices remain in a small range for a while. In other words, you are looking at a market with low volatility. If the value remains low for a while, it could indicate a potential reversal or continuation move and an area of consolidation.
Although many traders use the ATR to determine their stop or exit point, you can also use it to identify entry points. For example, suppose that the market moves up 40% above the average, which indicates an entry point.
However, just because the prices are climbing does not mean that it will continue to do so. If the prices are already way higher than the average, then there is a good chance that the price will fall back to that average. In such a case, traders should short sell after identifying an exit point.
Another useful feature of the ATR indicator is that it can help traders spot breakouts before they happen. You don’t want to miss a breakout as it presents one of the best trading opportunities. When the price consolidates, the ATR will show you low values. This means that the market is experiencing low volatility. This is a sign of an imminent breakout that leads to high volatility again.
Here, the ATR helps traders time such breakouts efficiently and allows them to ride the trend as soon as possible. After a period of low or flat values, there will be a surge in ATR which indicates higher volatility in the market again. With this information, traders can plan how they can trade the subsequent breakout.
The ATR Indicator Exit Strategy
There are a few exit strategies that require the use of ATR, some of which we will discuss here.
Using a Signal Line for the ATR Indicator
The ATR only gives you information about the market’s volatility. It does not tell you when is the best time to enter the market. For this purpose, traders can overlay on the ATR that acts as a signal line. For example, you can add a 20-period simple moving average over the ATR.
You are looking for the moment when the two lines meet. If the ATR crosses the simple moving average line and goes above it, this is the perfect time to buy in aggressively as both lines confirm an uptrend. If the ATR crosses the line and goes below it, that means a downtrend. Traders usually place sell orders when this happens.
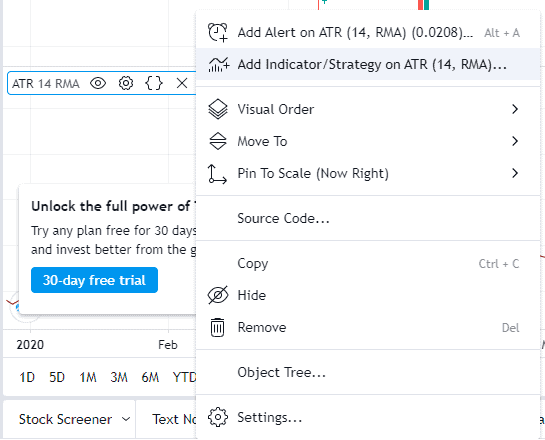
To do this, you might need to use the TradingView chart. The interface is simple. First, you add the ATR indicator as normal. Then, mouse over the 3 dots, click, and you should see this.

From there, just select “Add Indicator”, select the moving average option, then you should have the moving average and the ATR indicator displaying on top of each other, giving you a clear view of when the line intersects.
Trailing Stop Loss Strategy for the ATR Indicator
Traders use trading stop loss to help them maximize their profits if the market goes in their favor while protecting them from loss if it hits a certain threshold. That means, you can use it to exit a trade if odds are stacked against you, but also helps move your exit point if the market is in your favor. To do this, many traders use the ATR to figure out where to place their trailing stop loss.
This is a simple process. As you are looking at the chart, keep an eye on the ATR reading. A rule of thumb is to multiply the ATR value by 2. That will be your stop-loss point. If you are buying into the market, then the stop loss should be at least twice the ATR below the entry price. If you are exiting, the exit should be at least twice the ATR above the entry price.
If you’re long, you can move the exit as much as you want so long as things go your way. You can continue to move the stop loss twice the ATR below the price as it goes up. With this, the stop loss moves up with the price. The exit will remain there until the prices go up again or until the price comes down to hit the trailing stop loss level, which closes the trade.
Trailing stop loss also works for short trades, except the stop loss moves down. For instance, suppose you take a long trade at $20, with the ATR sitting at $0.25. The stop loss would be $19.5 (2 * $0.25 below 20). When the price goes up to $20.50 and the ATR is still at $0.25, your trailing stop loss is now at $20. When the prices go up to $21, the stop loss goes up to $20.50. Here, you have already secured 50 cents of profit on the trade. You would continue to benefit from this so long as the price goes up. Once the price hits the stop-loss point, you are out with the profit you’ve accumulated so far.
How to Use the ATR Indicator for Stop Loss
You may spot a flaw in the trailing stop loss strategy above. The problem is that there is a chance for the market to hit your stop loss, which then put you out of the trade, but then continues to move up. This really ruins your potential for a larger profit.
This is what happens when your stop loss is too narrow. In other words, you may have set your stop loss level too close to the prices. The solution then is to give it some more breathing room to accommodate the daily ups and downs of the market.
Then it is just a matter of setting a large enough buffer, but how large should it be?
It’s easy. First, look at the current ATR value, then select a multiple of that value (1x, 2x, 3x, 4x, etc.). Select the value closest to the support and resistance level.

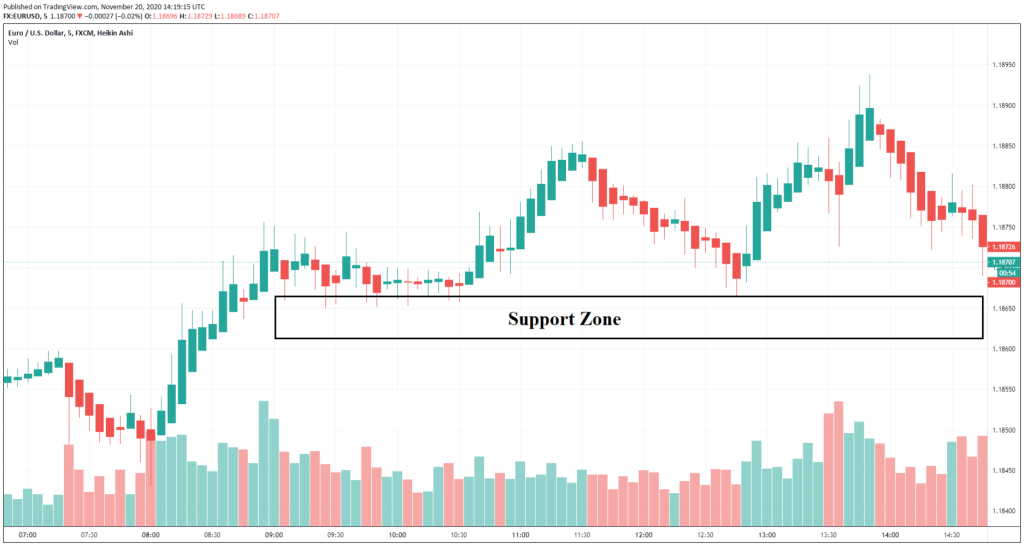
The support level is an area below the prices where they do not go any lower. It is the price floor.

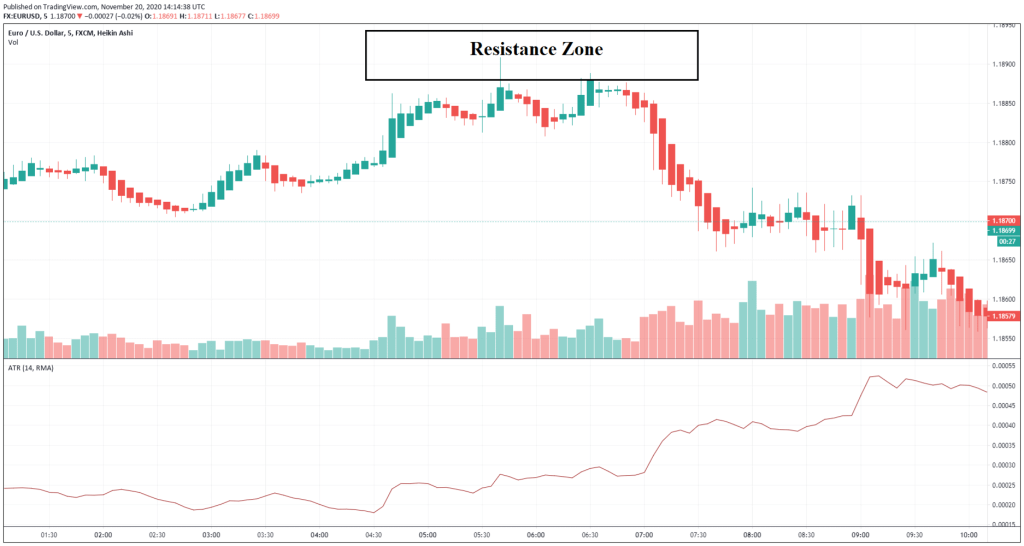
The resistance level is an area above the prices, so this is the price ceiling.
Another thing worth considering about the support and resistance level is that they are more like zones than lines, as illustrated above. They represent an invisible barrier that prevents prices from going lower or higher, respectively. However, that zone is not fixed. The more those zones are “tested”, meaning when the prices enter said zones, the weaker they become. That means, there is a potential for the price to go beyond those zones the more they are tested.
So, if you are long from the support level with the multiplier of 2, set your stop loss at 2 ATR below the lows of support. If your ATR value is 15, then 2 ATR is 30. Alternatively, if you are short from resistance, with the multiplier of 1, set your stop loss 1 ATR above the highs of resistance.
The ATR Stop Loss Calculator
Calculating stop loss for the ATR is a simple process. You just look at the current value of the ATR and multiply it by whatever number you want. Again, the rule of thumb is 2. This is where things can get tricky for new traders. Take the current value of the ATR and consider it to be a unit. So, if the current ATR is 20, then 1ATR = 20. If you want to place a stop loss 2ATR below the support level, that means 40 pips. A pip is the smallest currency unit, or the last decimal. So, if the price at the support level is 1.4558, then your stop loss is at 1.4518. A pip in this case equals to 0.0001, so 40 pips are 0.004.
Conclusion
There you have it. This is all you need to know about the basics of ATR indicator. As with all other tools in forex, your strategy determines how you can use them to maximize your profit.


