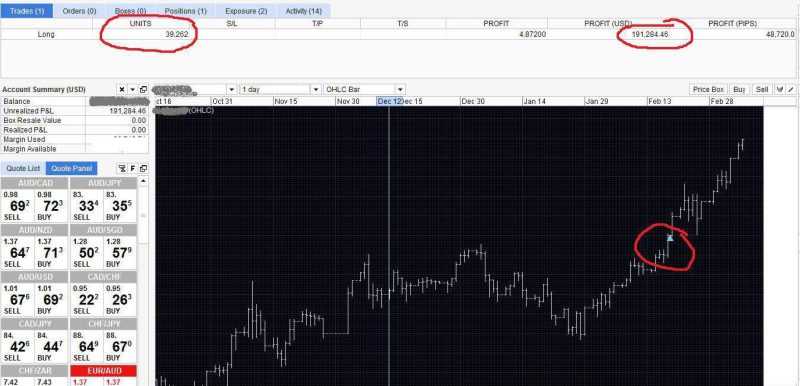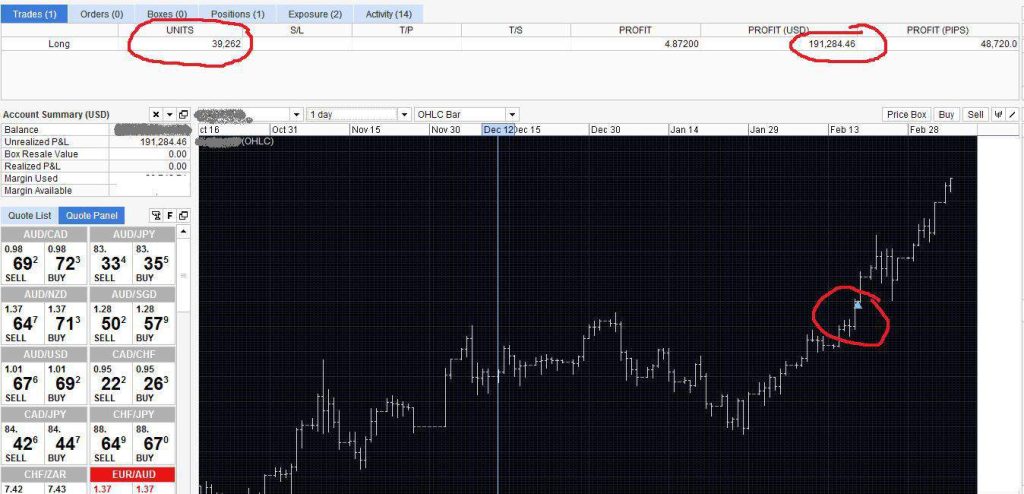
Traders depend on technical indicators to understand the market dynamics, and Andrews Pitchfork offers some of the more advanced options for recognizing trends. The popular tool in foreign exchange trading consists of three parallel lines that help identify trading prospects.
Investors are familiar with basic channel structures, but Andrews pitchfork takes things a step forward and is a channel trading methodology with profit opportunities.

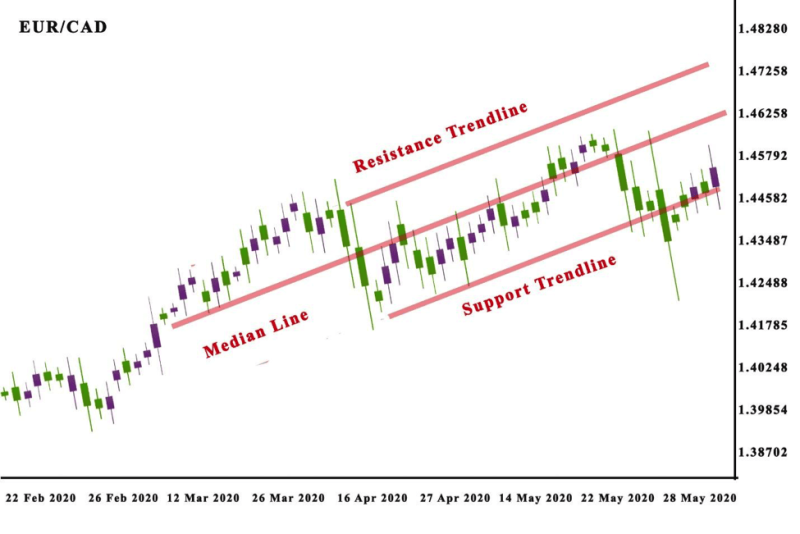
It is an on-chart technical indicator that forms around recent price action. The structure of the Andrews Pitchfork indicator is created by two parallel lines and a median line. The indicator is used to estimate the price behavior in rising trends.
The lines on the chart are drawn by selecting three points, most frequently reactions low and high, and as usual, the outside lines indicate support and resistance.
As long as the channel stays in place, the trend will be stable, but if the price moves outside the boundaries created by the Andrews pitchfork.
Also read: Best Technical Indicators for Day Trading
Contents
- Follow the Median Trend Line
- What Does the Indicator Reveal?
- Breakouts in the Upper Trend Line
- Support and Resistance Levels in the Middle Line
- Constructing Andrews Pitchfork on a Chart
- Trading Within Andrews Pitchfork Median Line
- Confirm the Validity of the Andrews Pitchfork
- Difference Between Andrews and Schiff Pitchfork
- Trigger Lines
- Limitations of Using Andrews Pitchfork
- Use Pending Orders
- Conclusion
- FAQs
Follow the Median Trend Line
Several trading platforms and charting packages offer the Andrews pitchfork indicator. Compared to standard support and resistance lines, the program will provide two strong support or resistance lines with a middle line that has the role of an imitation regression line.
The developer of the indicator, Alan Andrews was convinced that market price action will move in the direction of the median the majority of the time with or changes in sentiment for the remaining time. The effect is a longer-term trend that stays stable no matter the fluctuations.
If the attitude switches and supply and demand change, prices will drift, forming a new trend. These are the moments that can produce large profit opportunities in the Forex markets.
Brokers can improve the precision of their investments by drawing the pitchfork in tandem with other technical indicators.
What Does the Indicator Reveal?
Investors buy a stock when the cost declines close to support at the center trend line or the lowest trend line. Contrary traders sell the asset when it reaches the resistance of the middle line or the upper trend line.
The middle line can help in recognizing positions where a stock can locate support or resistance, it is usually not as potent as the two outside lines.
Identifying the levels makes it very useful to recognize options for stop-loss orders.
Also read: Most Accurate Intraday Trading Indicators
Breakouts in the Upper Trend Line
Andrews pitchfork tool can be implemented when trading breakouts over the upper trigger line and breakdowns under the lower trend line. Investors that use the strategy have to be careful about false indicators and use indicators to measure the potential of the breakout on the trend lines.
Support and Resistance Levels in the Middle Line
Investors can start a position as soon as the cost of an asset arrives at the lower trend line. The short position can be started, if the price reaches the top line.
Investors may look into booking a small part or all earnings when the asset price comes to the adverse side of the pitchfork. Ahead of starting a position, investors need to make sure support and resistance are at these levels.
The price can often connect with the center trend line when an asset is trending indicating speeding up in the trend.
Constructing Andrews Pitchfork on a Chart
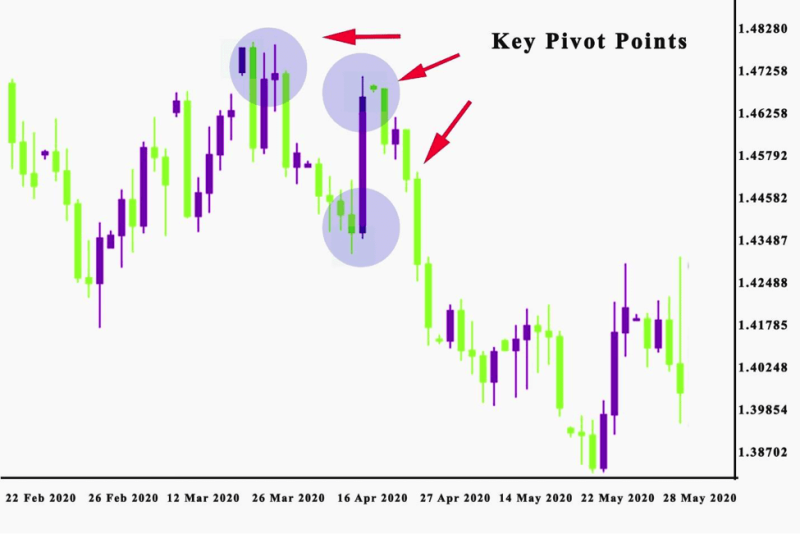
To create the pitchfork channel in a chart, you have to locate three consecutive big highs or lows in the stock’s price.
Indicate these turning points on the chart, then draw a straight line that begins at the initial point and goes in the middle of the next two pivot points, creating the indicator’s central line that is similar to handle on a pitchfork, this is how the indicator got its name.
When that is completed, draw the remaining lines that begin from the second and third pivot points and travel parallel with the median line, creating the pitchfork’s prongs.
It’s not easy to form the Andrews Pitchfork indicator, the main reason is that subjectivity comes into play when deciding what are the important highs and lows in an asset's price.
Still, when the lines are plotted the indicator is easy to use and trading platforms usually perform the process automatically with the trader’s subjectivity clouding the decision.
Trading Within Andrews Pitchfork Median Line
People are making a living formulating theory, but what counts is how ideas get implemented in the real world.
The indicators a trader uses must be efficient in the market where he can make a profit.
We can look at an example of a EUR/USD currency pair . that has bounced off of the median line and has climbed to the top resistance of the pitchfork.
When the buying momentum starts to lose strength, it creates a cross-like formation under the upper prong. If you use a stochastic oscillator, you can spot the cross under the signal line, and that verifies the downside momentum.
Traders are advised to implement an entry just under the close of the third candle when using the indicator in their trading strategy.
The entry would be implemented on the downward momentum as the price action starts moving in the direction of the median line. With solid management, the trader could make close to 1000 pips over the life of the trade.
Confirm the Validity of the Andrews Pitchfork
When you have your chart with the Andrews Pitchfork indicator in place you must verify its authenticity. Completing this step, you can be convinced that the trade is valid and can be profitable if you stay the course.
The Pitchfork indicator is valid if the price action shows reactive movements off the channel lines.
Most trading platforms will indicate these with arrows or other symbols, when the price comes in contact with the pitchfork lines then it acts fast by bouncing in the other direction.
There are situations where the price action locates support or resistance at the pitchfork levels.
Yet if the price action contacts the support trendline, it leaps fast in an upward direction. While if the price action touches the resistance trendline, it bounces in a downward direction.
Most trading platforms have capabilities to identify the type of trend that is bullish or bearish.
Difference Between Andrews and Schiff Pitchfork
The Schiff Pitchfork evolve from the Andrews Pitchfork lines after the inventor Jerome Schiffer realized that the channels were too steep in weak market trends. He modified the pitchfork by plotting points B and C halfway between the starting point and the turning point.
The trend is perceived as operating if the price remains amid the 3 lines. The Schiff pitchfork is thin and will not include pointed angles.
Many traders think the Schiff Pitchfork is a more focused variation of the original Andrews indicator.
The Andrews Pitchfork and the Schiff Pitchfork are both effective for investors, especially in the forex market.
In most scenarios Andrews and Schiff Pitchforks produce identical results, meaning the time has come to buy or sell. When this is obvious traders make transactions with more confidence.
The Schiff Pitchfork’s accuracy is more practical for transactions in flat price trends. If price movements are restrained, performing trades at both sides of the price channel can be lucrative.
In situations where the price trend is more erratic, the standard Andrews Pitchfork will be more helpful in identifying price movements.
Pitchforks help identify price movements, and investors utilize them in different speculative markets.
By learning to implement the trigger lines these productive tools brokers can benefit from these tools in their trading strategy.
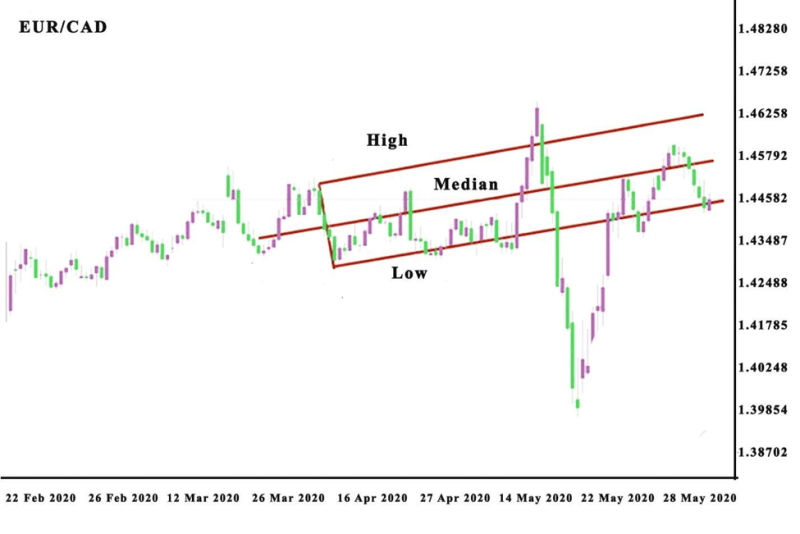
Trigger Lines
Andrews assimilates trigger lines, that are trend lines that start at point one. In this setup the upper trigger lines develop cascading from mark one amid the summit at mark three. When a break develops over the upper trigger line can be interpreted as a signal to purchase the asset.
While lower trigger lines develop up from mark one through mark two. When a break is initiated under the lower trigger line it can be understood as a sell indicator. Trigger lines are comparable with ordinary trend lines created from two reaction lows or highs. Indicators from ordinary trend lines are generally produced with a delay when compared with indicators created by Pitchfork breaks.
Limitations of Using Andrews Pitchfork
The biggest challenge in using the indicator is having the skill to choose the reliable three points on the chart that will form the channels.
How proficient the indicator will be is dependent on those points. Traders experiment with different highs and lows, making different variations to see what are the most successful price points.
Price action trading is more than observing a technical indicator on charts or implementing a drawing tool. Brokers that look for success in price action trading, have to learn the market principles and create a strategy for appraising the market. Yet, pitchfork-based trading strategies can be practical, if they are properly used.
Use Pending Orders
It is worth remembering to use pending orders when implementing the pitchfork indicator. Traders can place a buy stop order over the first support and have a stop loss at the median line.
If the price moves over the support level, the stop trade will be started. It will then be stopped when the price contacts the median point.
Yet if traders have all stopped trade under the second support level. Because the price breaks under the lower line, the trade will be initiated.
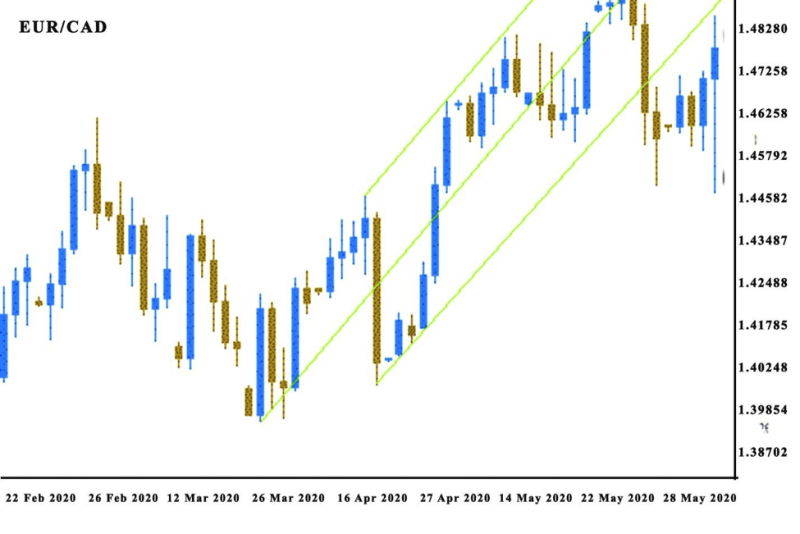
Conclusion
Several Andrews Pitchfork trading strategies can be created around the Pitchfork trading system lines. To effectively use this system, investors need to learn what Andrews Pitchfork is, and that is not hard just have to follow some basic rules and monitor the trigger lines.
Price usually moves towards the median line. When price breaks the median line there is a high chance it will pull back to retest again the median line.
When price breaks the Pitchfork channel on the other side of the channel direction, there is a transfer in market sentiment and a trend reversal is possible.
Andrews Pitchfork offers currency traders profitable opportunities to capitalize on preferably longer market swings. It is also frequently used in the futures and equities markets.
When the pitchfork is used correctly in combination with rigorous money management and textbook technical analysis, a trader can isolate excellent options while filtering choppier price action in the forex trending markets.
FAQs
What is Andrews Pitchfork in Forex?
The Andrews pitchfork is an indicator used in a series of three trendlines to locate trends and reversals, by identifying the support and resistance.
How Do You Plot Andrews Pitchfork?
It is formed by placing three points at the end of previous trends and then drawing a line from the first point that goes up the midpoint of the other two points.
What Is the Pitchfork Used for in Trading?
The Andrews Pitchfork indicator is a tool used to forecast market reversals, enabling the identification of a channel in which an asset is likely to trade.
How Do You Modify Andrews Pitchfork?
The Andrews pitchfork is the standard pitchfork but there are two other versions of Schiff pitchforks and modified Schiff pitchforks. The difference is that with the Schiff setting is that the angle or slope of the median line is much flatter than that of a standard setting.


