Forex traders live by the mantra the trend is your ally. The concept is simple, if the course of a trend is powerful then investors can reduce the risk and improve the potential for higher earnings.
But how can they predict the direction a trend is taking? Especially in today’s dynamic world where a political crisis or environmental can derail a currency and put the market into a nosedive.

To combat market fluctuation investors, use technical indicators that give an insight into the direction a market is going to take.
In their tool kit, the average directional index is prominent as an instrument for recognizing trending markets and the potential of the trend to remain on the optimal side.
The index was formulated by Welles Wilder in the ’70s of the last century. He was an engineer by trade but become a stock market analyst and contributed with a trading strategy that is a staple for over four decades.
Also Read: TRIX Indicator
Contents
- What Is The Average Directional Movement Index
- Tactical Use Of ADX
- What The Average Directional Index Lines Show Us
- Best ADX Trading Strategy
- ADX And Other Directional Movement Indicators
- Conclusion
- FAQs
What Is The Average Directional Movement Index
At the core of the ADX indicator is a mix of an oscillator and a trending indicator. These may not seem like a simple trading strategy because of the absence of signals for initiating trades and the formula for estimating the index can be hard to learn.
The ADX is a variation of the Wilder’s positive directional indicator and negative directional indicator, with the inclusion of a SMA. Although both are suggestive of trend direction, the ADX affirms the trend strength by itself.
As a lagging indicator, it’s not great for predicting market changes but for verifying current price trends after they have started to form.
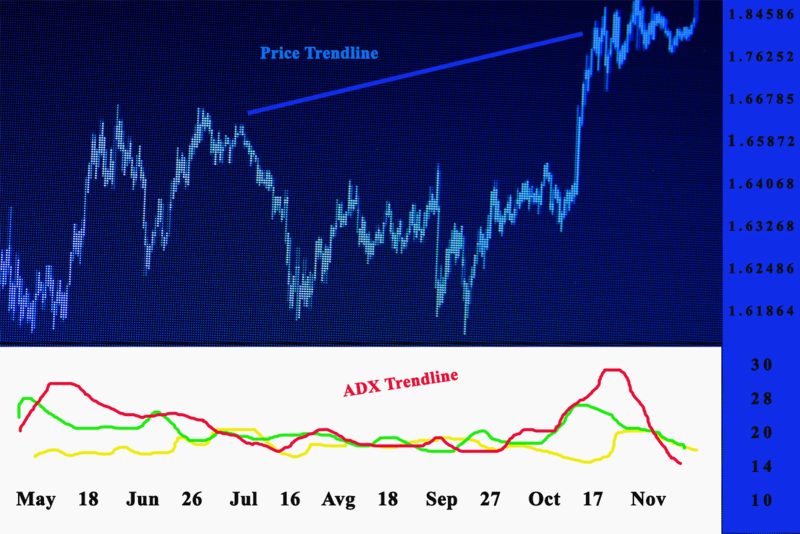
When observing the ADX on a chart you can spot three disconnected lines to display the trend along with the positive and negative directional indicators.
This trend strength indicator can estimate the price movements of securities or other types of trading vehicles. ADX can be used when trading stocks as well as other types of assets.
The average directional movement index is used to mirror the enlargement, or deflation of the price range of a security over a given period. The default parameter for the ADX indicator is 14 time periods, but analysts frequently used the ADX as low as seven or as high as 30.
Lower settings provide faster reactions to price movement but are in the habit of producing false signals. Higher settings will reduce false signals but make the average directional index a more lagging indicator.

Tactical Use Of ADX
The price is the crucial signal of the state of the market when looking at a chart. Traders need to look at the price before consulting the ADX, because it is useful only if you understand the context in which it is used, and the price provides the circumstances.
The point of an indicator is to reveal something more than the price is possible t do by itself. The best trends soaring out of periods of price range merger.
Breakouts from a range happen when there is a clash among buyers and sellers on price, which influences the equity of supply and demand. The proportions of supply than demand, and the opposite is the factor that forms price momentum.
Breakouts are easy to identify but they frequently do not develop further. The ADX indicates if the breakouts are real by displaying when ADX has the potential for price to trend after the breakout. When ADX soars under 25 to over 25, the price is powerful enough to advance in the direction of the breakout.

What The Average Directional Index Lines Show Us
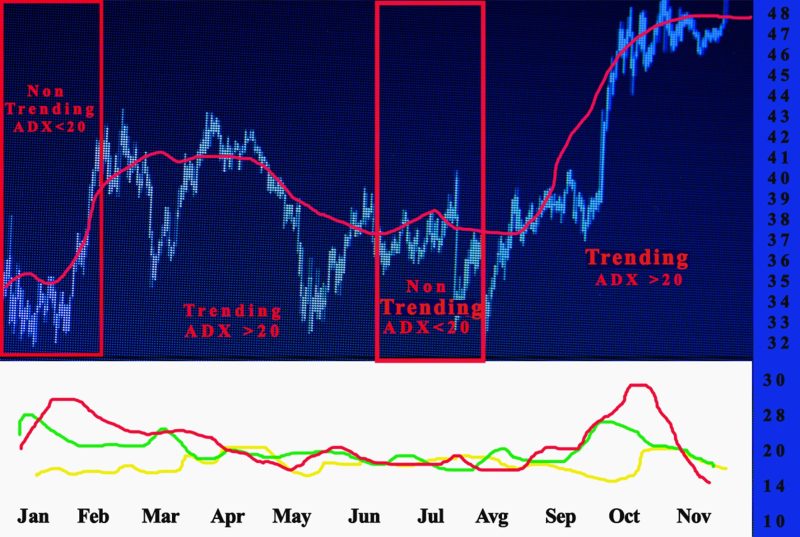
- If the ADX is under 20, no trend is occurring.
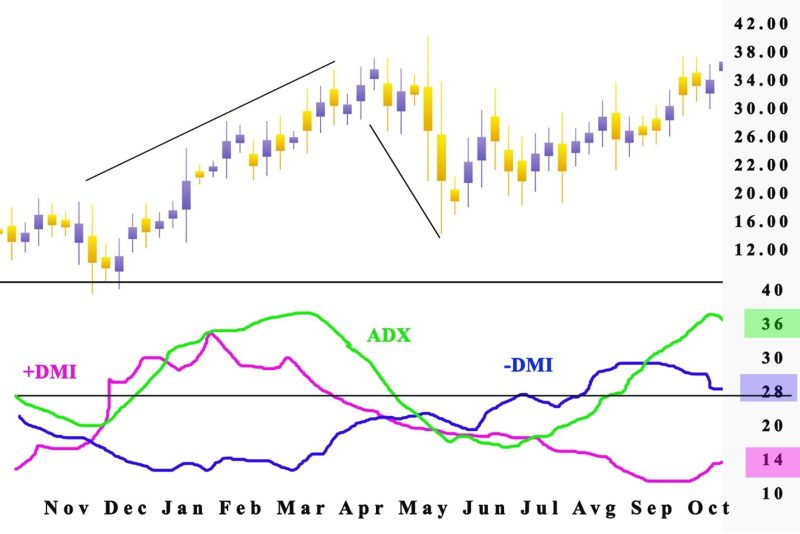
- If the DMI+ line sits over the DMI- line, this signals that prices are trending up. The ADX line estimates the potential of the upward trend.
- If the ADX is over 25, a strong trend is present.
- If the DMI- is over the DMI+, this displays that prices are trending downward, with the ADX line estimating the downtrend’s potential.
- If the ADX line is beginning to soar, the market is displaying a strengthening trend.
- If the ADX line is beginning to turn down from its high values, it signals the end of an upward or downward trend.
Best ADX Trading Strategy
The indicator can be applied in several strategies that incorporate starting transactions small timeframes and higher. If you use the ADX, you can do research ahead of time not matter if sideways movement is occurring in the market, and gets signal verification of a market dynamic.
Most traders want to know the greatest intraday ADX technique, looking for a leveled period in the day, accepting signals established on patterns, and starting a transaction when the price leaves the leveled area of the chart. The strategy is useful by discerning amid the beginning of a powerful trend and an inaccurate breakout.
When choosing a technique type the timeframe limitations are not useful in swing trading, while long-term strategies create swap losses.
The most important thing is to choose the tools, like the key signal for the strategy, and observe if any pattern emerges. Patterns and breakout/bounce of levels are additional signals.
It is recommended to research the market on larger timeframes and begin transactions on lower timeframes.
The basic factors must be in focus because they seriously influence the price. It should not be forgotten that the signals can present lagging data.
Trades should be avoided in periods of breaking news the alternative is to place stops on open trades. Or close trades.
You are the only one who can choose the best ADX strategy, that’s why you have to choose the best combination of indicators and try the different options with a free account on a trading software of your choosing.

ADX And Other Directional Movement Indicators
Traders usually combine the ADX with other momentum tools to verify divergences and entry and exit signals counter to overbought and oversold readings for more accuracy. Indicators that are used in tandem include the relative strength index and the stochastic oscillator.
Trend direction can also be confirmed with the moving average convergence divergence (MACD).
The stochastic oscillator and MACD are preferred pairing because of their appreciative roles in analyzing trade possibilities. The ADX contributes to this value, and MACD offers extra context to moving averages that can correct shortcomings of lagging indicators in general.
On the other hand, RSI is a good mix with the ADX when attempting to boost the timing of trades based on ADX information. The ADX shows the strength of a trend and the RSI enables the location of the appropriate time to start a position, increasing earning and offering accuracy in the trading strategy.

Conclusion
Technical analysts use indicators to determine trend’s strength so they can identify buy signals. In technical trading systems, adx readings quantify trend strength.
Most lucrative earnings arrive from trading the stable trends and escaping range conditions. ADX not only locates trending conditions but also enables investors to locate the strongest trends to trade.
The capacity to apprise trend strength is a huge advantage for a broker. ADX also determines range circumstances, so a trader won’t get bogged down attempting to trend trade in sideways price action.
When using a technical analysis tool like the average directional index adx reading can show the actual direction of the trend can be revealed and traders can figure out if its a weak trend or the values are rising in the market.
The Directional Movement System indicator estimates are complex, but analysis of the data is easy while proper application training is needed. Chartists have to be careful and filter +DI and -DI that frequently occur with appreciative analysis.
Also Read: How To Use The Fractal Indicator
FAQs
Is ADX a Good Indicator?
It is a great trend indicator that can minimize risk and rising opportunities for profit. The average directional index is used to identify if the price is trending with determination.
What Is the Best Setting for ADX Indicator?
The profred setting is 14 periods but analysis use settings that are o the low side of 7 and can go up to 30. When using the lower setting the indicator reacts faster to the tendencies of the price but is not as reliable.
What Is ADX and How it Is Calculated?
Calculating the ADX begins with pining down the plus and the minus of the directional movement. The +DM and -DM are located by estimating the “up-move,” or present high minus the preceding high, and “down-move,” or present low minus the preceding low.
What are the Three Lines in ADX?
Traders identify three lines on the chart the ADX but also the plus directional indicator (DI+) and the minus directional indicator (DI-).


