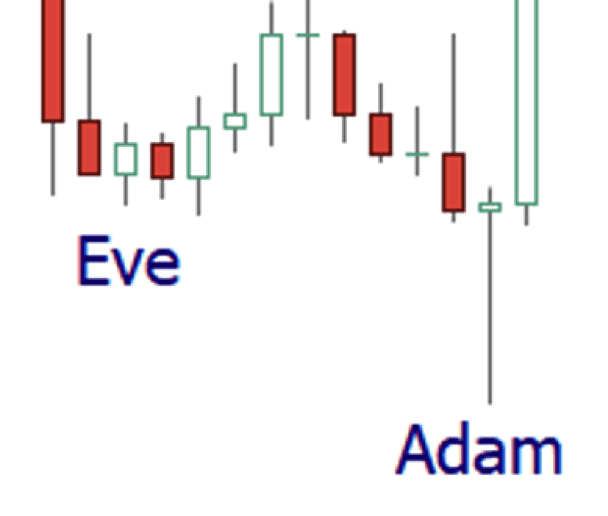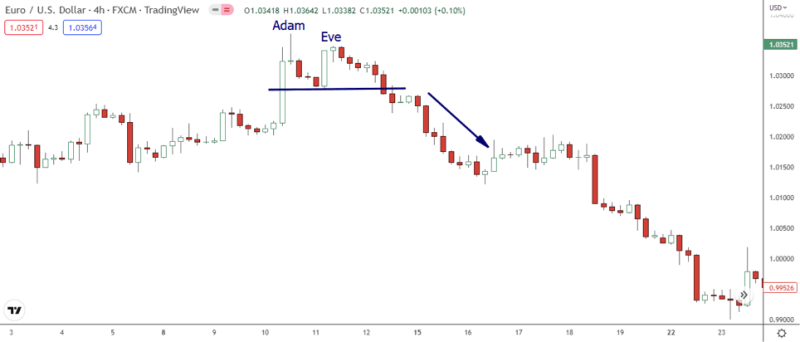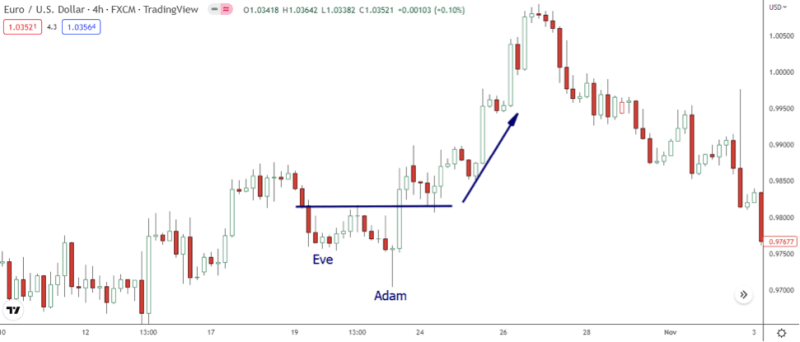
The Adam and Eve chart pattern is distinct in that it has two bottoms, one that is wide and fairly flat or rounded and the other that is narrow and V-shaped.
This pattern holds a distinct place when it comes to short-term bullish reversal chart patterns.
When traded following the recommendations provided in the following sections, you can anticipate a profit chance of 65% to 70% and an average return of 33%. The Adam and Eve pattern has an exceptionally high win rate in downtrend markets.
In this guide, you’ll learn what Adam and Eve pattern is and how to apply this technical chart structure to anticipate profitable trading opportunities.
Also Read: Breakout Patterns: Profitably Trading the Chart Pattern Disruptions
Contents
- What Is An Adam And Eve Pattern?
- Understanding The Adam And Eve Formation
- Different Formations Of Adam And Eve Patterns
- Bottom Line
- FAQs
What Is An Adam And Eve Pattern?
Adam refers to the appearance of the bottom, which is narrow, pointed, and possibly with a one-day downward spike. Eve’s bottoms appear wider and more rounded. They tend to be more numerous and shorter if they have spikes.

The body length and tail of the candle frequently separate Adam and Eve from one another. While Eve’s bottoms tend to widen over their height, Adam’s bottoms tend to remain narrow.
It can be a good sign for a long entry point when there is a break out above the previous highest price in the Eve cup. The higher point between the two bottoming patterns is where the longer-term resistance zone is located, which can be a secondary breakout signal.
Understanding The Adam And Eve Formation
According to Thomas Bulkowski’s Encyclopedia Of Chart Patterns, the Adam and Eve formation is distinguished by a sharp and deep first bottom on high volume (Adam). As the stock bounces, it begins to correct more gradually and prints a second bottom (Eve) with less volatility.
The rounded bottom of Eve takes longer to form than the spike of Adam, and it has lower volumes. The stock then breaks to the upside after the price action congests into a narrow range. When broken, the top of Eve makes a great entry point. The resistance is frequently found near the top of the pivot point for the center retracement.

They occasionally happen after parabolic rallies. When an Adam Eve formation shows a top, the opposite is true. Risk must be handled with extreme caution. You might think a bottom has been reached occasionally, only to find out it’s a breakout to new lows. Stop-loss must also be used disciplined. Avoid remaining too long because the failure of this pattern will quickly accelerate the downside.
Also Read: Harmonic Patterns – A Complete Guide
Different Formations Of Adam And Eve Patterns
Adam and Eve Double Tops
Adam and Eve double tops are a bearish pattern that frequently appears in uptrends and is distinguished by two peaks located close together and separated by troughs. According to Bulkowski, the absolute relative separation between the two peaks should not exceed 6%.

After the initial peak, the price must pull back at least 10 to 20% of the previous candle. The “confirmation” level is determined by the location of the trough in the formation. A short position should be opened if the price breaks this level, marking the pattern’s end. Bulkowski advises a 5% decline below the confirmation level to prevent fake breakouts.
When assessing the likelihood of a potential double top, the amount of time between two peaks is crucial. This separation should correspond to how long the uptrend lasted before the peaks. Peaks that are too close together do not necessarily signify a double top, while peaks that are too far apart could mean that the prior uptrend has passed its prime.
Adam and Eve Double Bottoms
Adam and Eve’s double bottoms are a bullish pattern that frequently appears in downtrends and is characterized by two parallel troughs spaced by peaks. According to Bulkowski, there should be a 6% difference in the absolute relative location of the two troughs.

After the chart prints an initial low, the price should retrace 10-20% live the previous example. The spot where the formation’s peak is located serves as the “confirmation” level; when the price breaks this level, the pattern is said to be finished, and a long position should be initiated. Bulkowski recommends a 5% decline above the confirmation level to prevent fake breakouts.
Similar to double tops, the time interval between two troughs should correspond to how long the downtrend lasted before the troughs. Double bottoms are subject to the same observations that apply to double tops.
Bottom Line
Adam’s pattern describes the bottom as narrow-pointed and possibly having a 1-day downward inclination, as the case may be. Eve’s top is rounder looking, and it’s wider. The spikes are usually larger and shorter if there are spikes. The differences between Adam and Eve are often the widest across their full height. The bottom of Adam is generally smaller, whereas Eve’s lower bottom is wider.
FAQs
What Is The Adam And Eve Pattern?
Adam refers to the bottom as a narrow, pointy bottom with perhaps a drop in the downward direction of the day. Eve’s bottoms look rounder or flat.
Is Adam And Eve’s Pattern Bullish?
Twin bottoms at roughly the same price characterize Adam and Eve’s double bottoms, which are bullish chart patterns.
What Is A Triple Bottom Pattern?
The triple bottom reflects the visual pattern showing the prices of the sellers and the bears. Generally, three lowers can bounce off support, followed by price actions breaking resistance.
What Is A Rounding-Top Pattern?
A rounding top is the chart pattern used for technical analysis based on price movements. It forms an upside-down “U.” Rounding tops can be found after extended higher trends and can signify sluggish long-term pricing movement.


