Hey, what’s up, traders! It’s Ezekiel Chew here, and today we’re going to talk about the Stochastic Indicator, one of the most widely used yet misunderstood trading tools in the market.
Let me ask you this: Are you using the Stochastic Indicator the right way?
Many traders believe that as soon as the stochastic hits overbought (80) or oversold (20), the price will immediately reverse—but that’s not how professional traders use it. In fact, using it the wrong way could be the reason you keep getting stopped out of trades.
When you understand how the Stochastic Indicator actually works, you gain a powerful tool to identify momentum shifts, enter the market at the right time, and avoid costly mistakes that most traders make.
📌 What You’ll Learn in This Guide:
✅ What the Stochastic Indicator is and how it measures momentum
✅ The #1 mistake traders make that leads to false signals
✅ How to time your entries using stochastic in trending markets
✅ Why overbought and oversold don’t always mean reversal
✅ How to combine stochastic with moving averages for better accuracy
✅ A step-by-step strategy to use stochastic the right way
📺 Watch the full breakdown in this video:
📉 Did you know that most traders are using the Stochastic Indicator the wrong way?
Many believe that as soon as the stochastic reaches the overbought (80) or oversold (20) levels, the price will reverse. But that’s not how professional traders use it.
If you’ve ever taken a trade based on stochastic signals and got stopped out because the market kept moving against you, don’t worry—you’re about to learn how to use this tool the right way.
By the end of this article, you’ll understand:
✅ What the Stochastic Indicator actually measures
✅ Why overbought/oversold levels don’t always mean reversal
✅ How to combine stochastic with trend analysis for better accuracy
Let’s dive in! 🚀
What is the Stochastic Indicator?📊
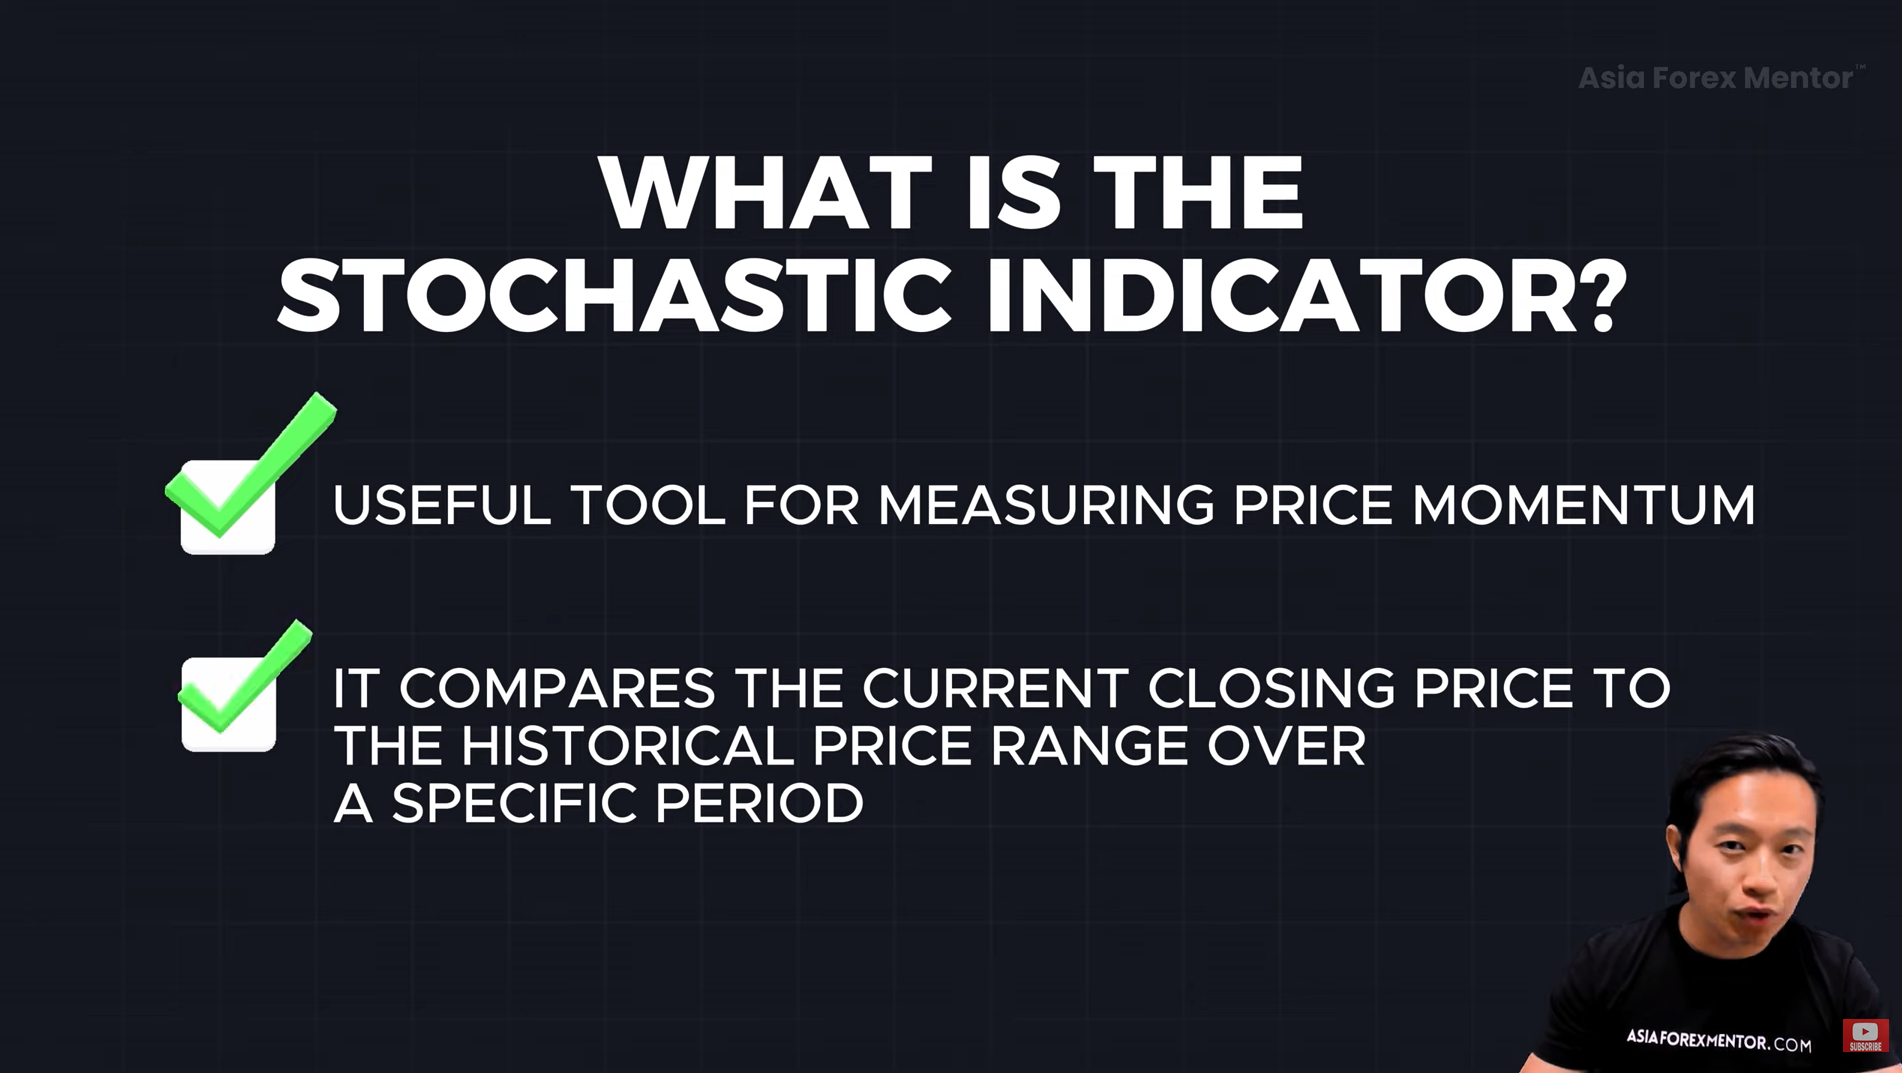
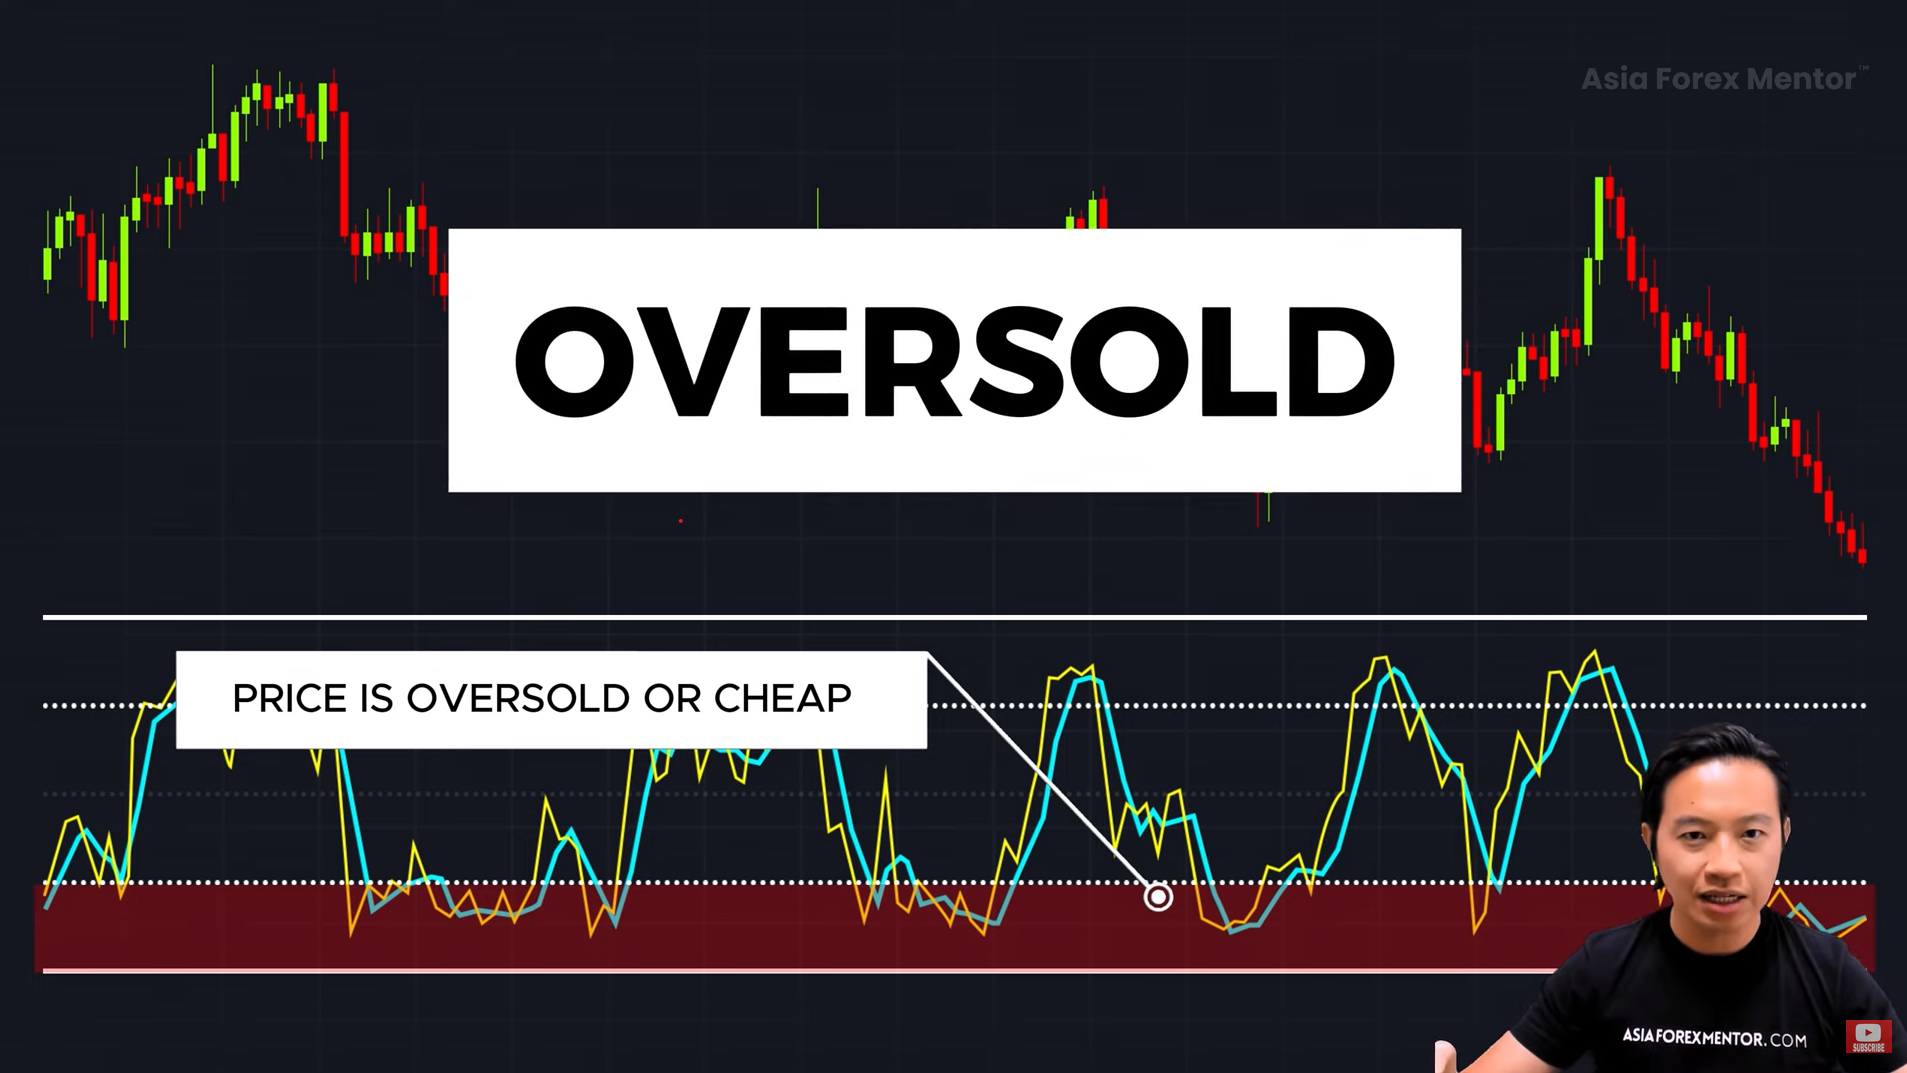
The Stochastic Indicator is a momentum oscillator that compares an asset’s closing price to its price range over a specific period.
Think of it Like Driving a Car 🚗💨
Imagine driving an F1 car at full speed. You can’t just make a sharp turn at max speed—you need to slow down first.
Similarly, when price movement slows down, it signals that a trend might be losing strength—potentially leading to a pause or reversal.
The 20 and 80 Levels 📈📉
The stochastic indicator consists of two key levels:
- Below 20 → Oversold (Price is “cheap”) → Possible buying opportunity 📌
- Above 80 → Overbought (Price is “expensive”) → Possible selling opportunity ❌
But here’s where traders mess up: assuming price will immediately reverse once it hits these levels. Big mistake! 🚨
The #1 Mistake Traders Make with the Stochastic Indicator⚠️
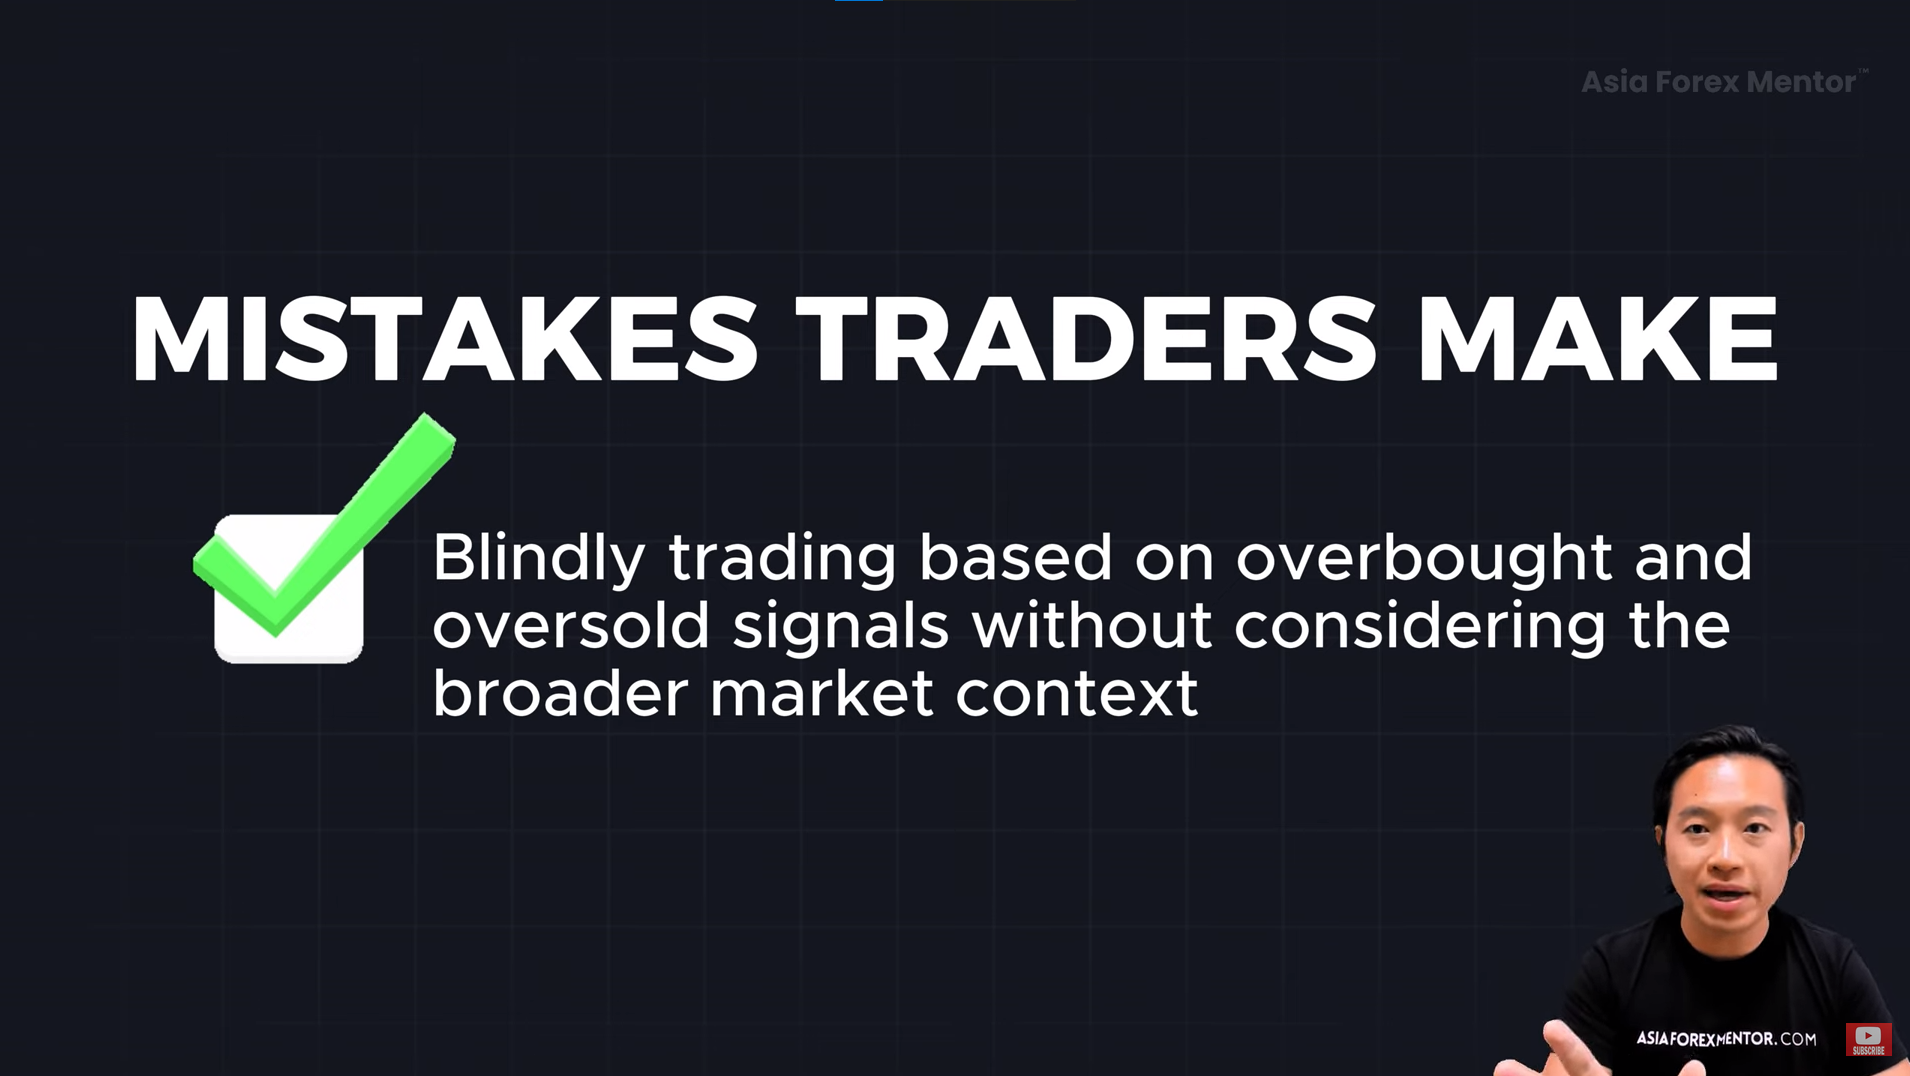
Mistake 1: Blindly Trading Overbought/Oversold Signals ❌
Many traders think:
📢 “Oh, the stochastic is above 80—time to short the market!”
What happens next? The market keeps going up 📈 and they get stopped out.
The Reality: Overbought ≠ Immediate Reversal
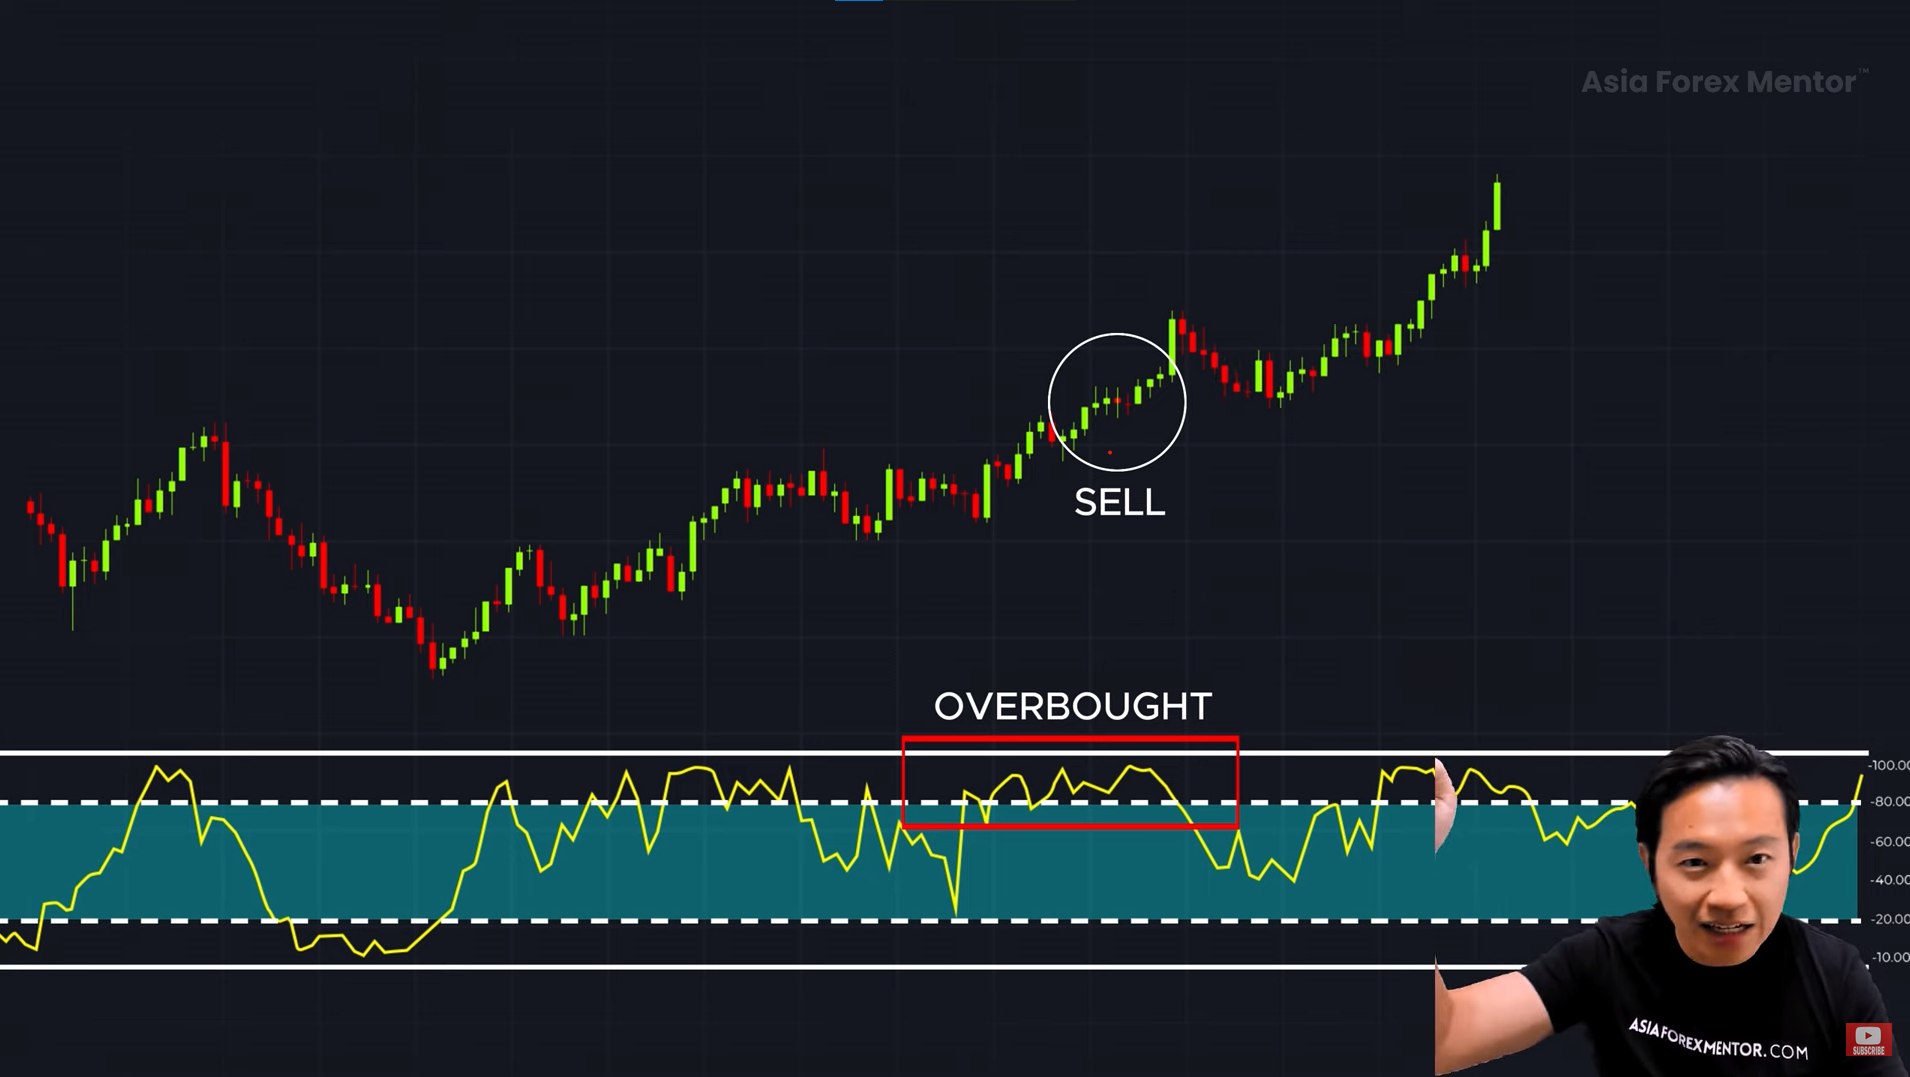
💡 In strong trends, price can stay in overbought/oversold areas for a long time.
So instead of thinking of stochastic as a reversal signal, think of it as a momentum indicator.
✅ Solution: Always consider the overall trend before making a trade.
How to Properly Use the Stochastic Indicator📌
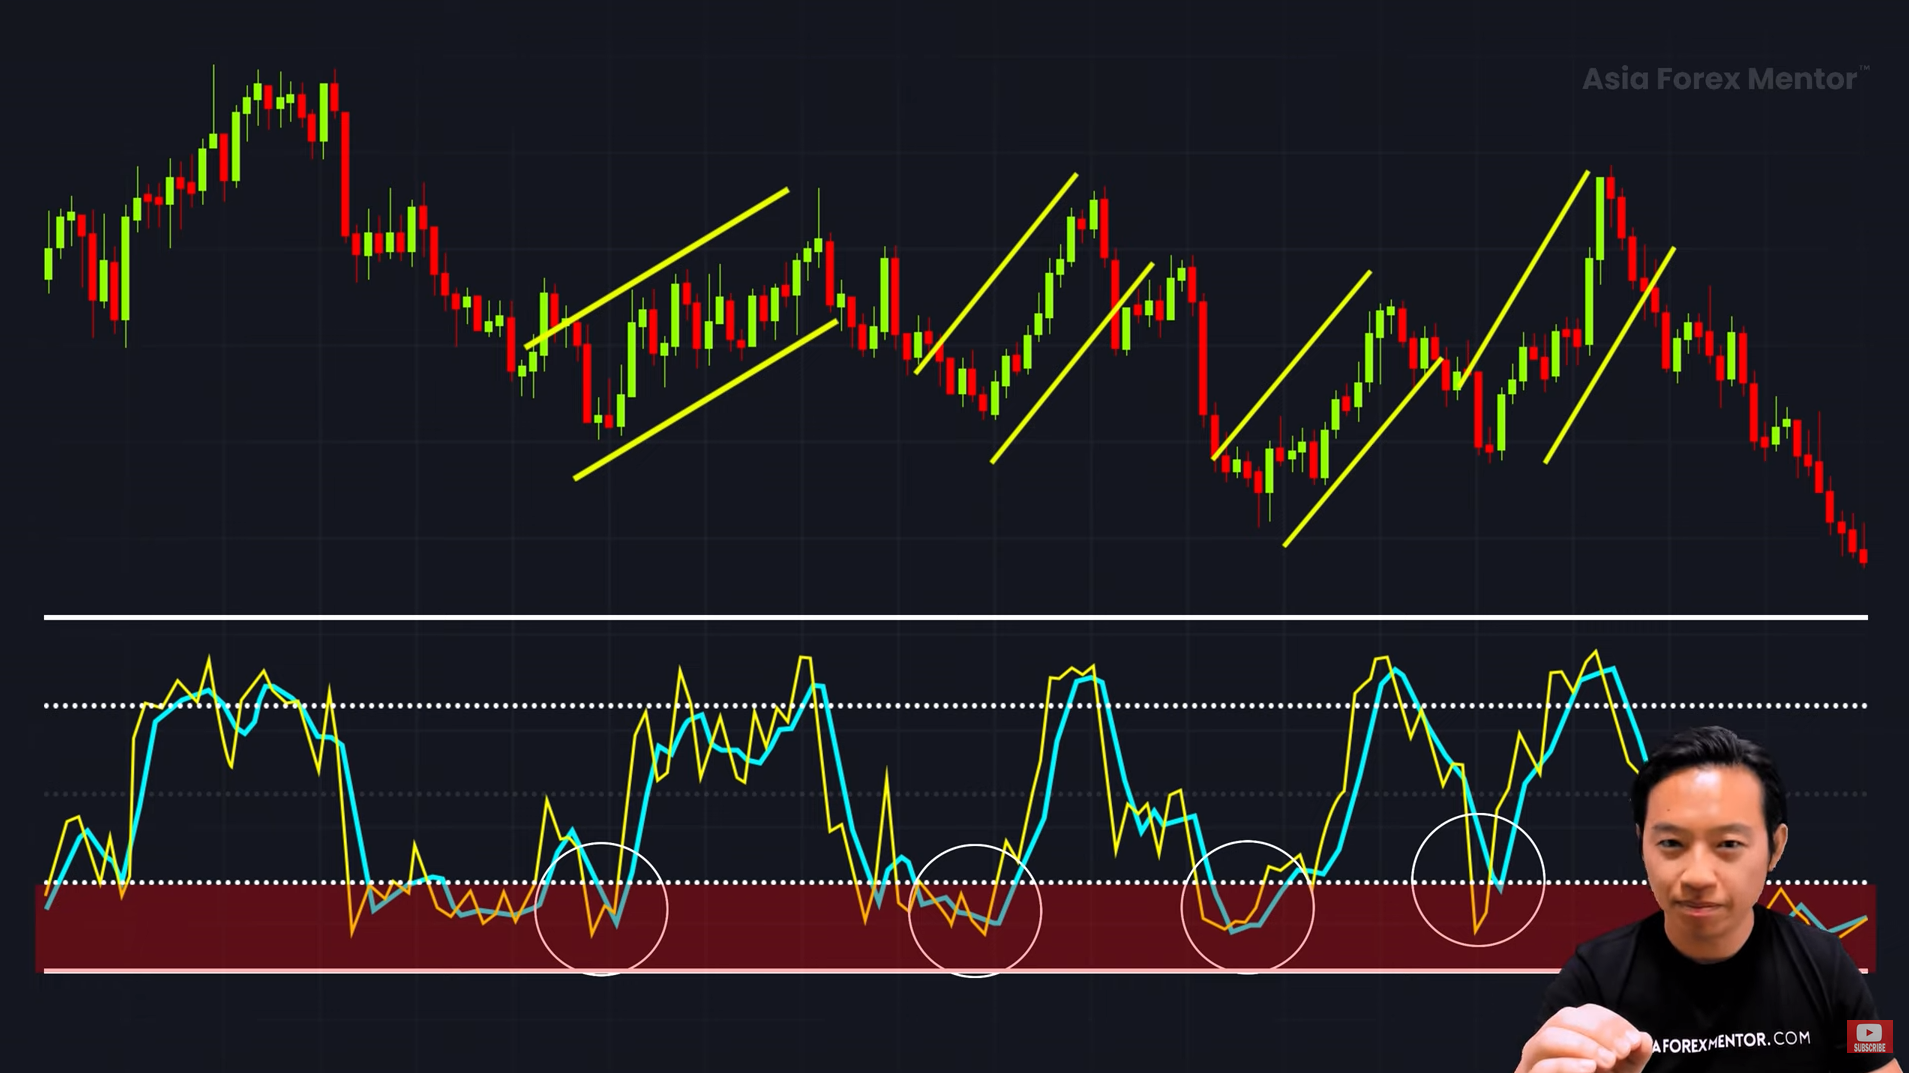
#1. Use Stochastic to Identify Pullbacks in Trends 🔄
One of the best ways to use stochastic is to time the end of a pullback in a trending market.
Uptrend Strategy (Buying During a Pullback) 🟢
✔️ Wait for the stochastic to dip below 20 (oversold).
✔️ Once the stochastic crosses back above 20, the uptrend may be resuming.
✔️ Enter a long (buy) trade.
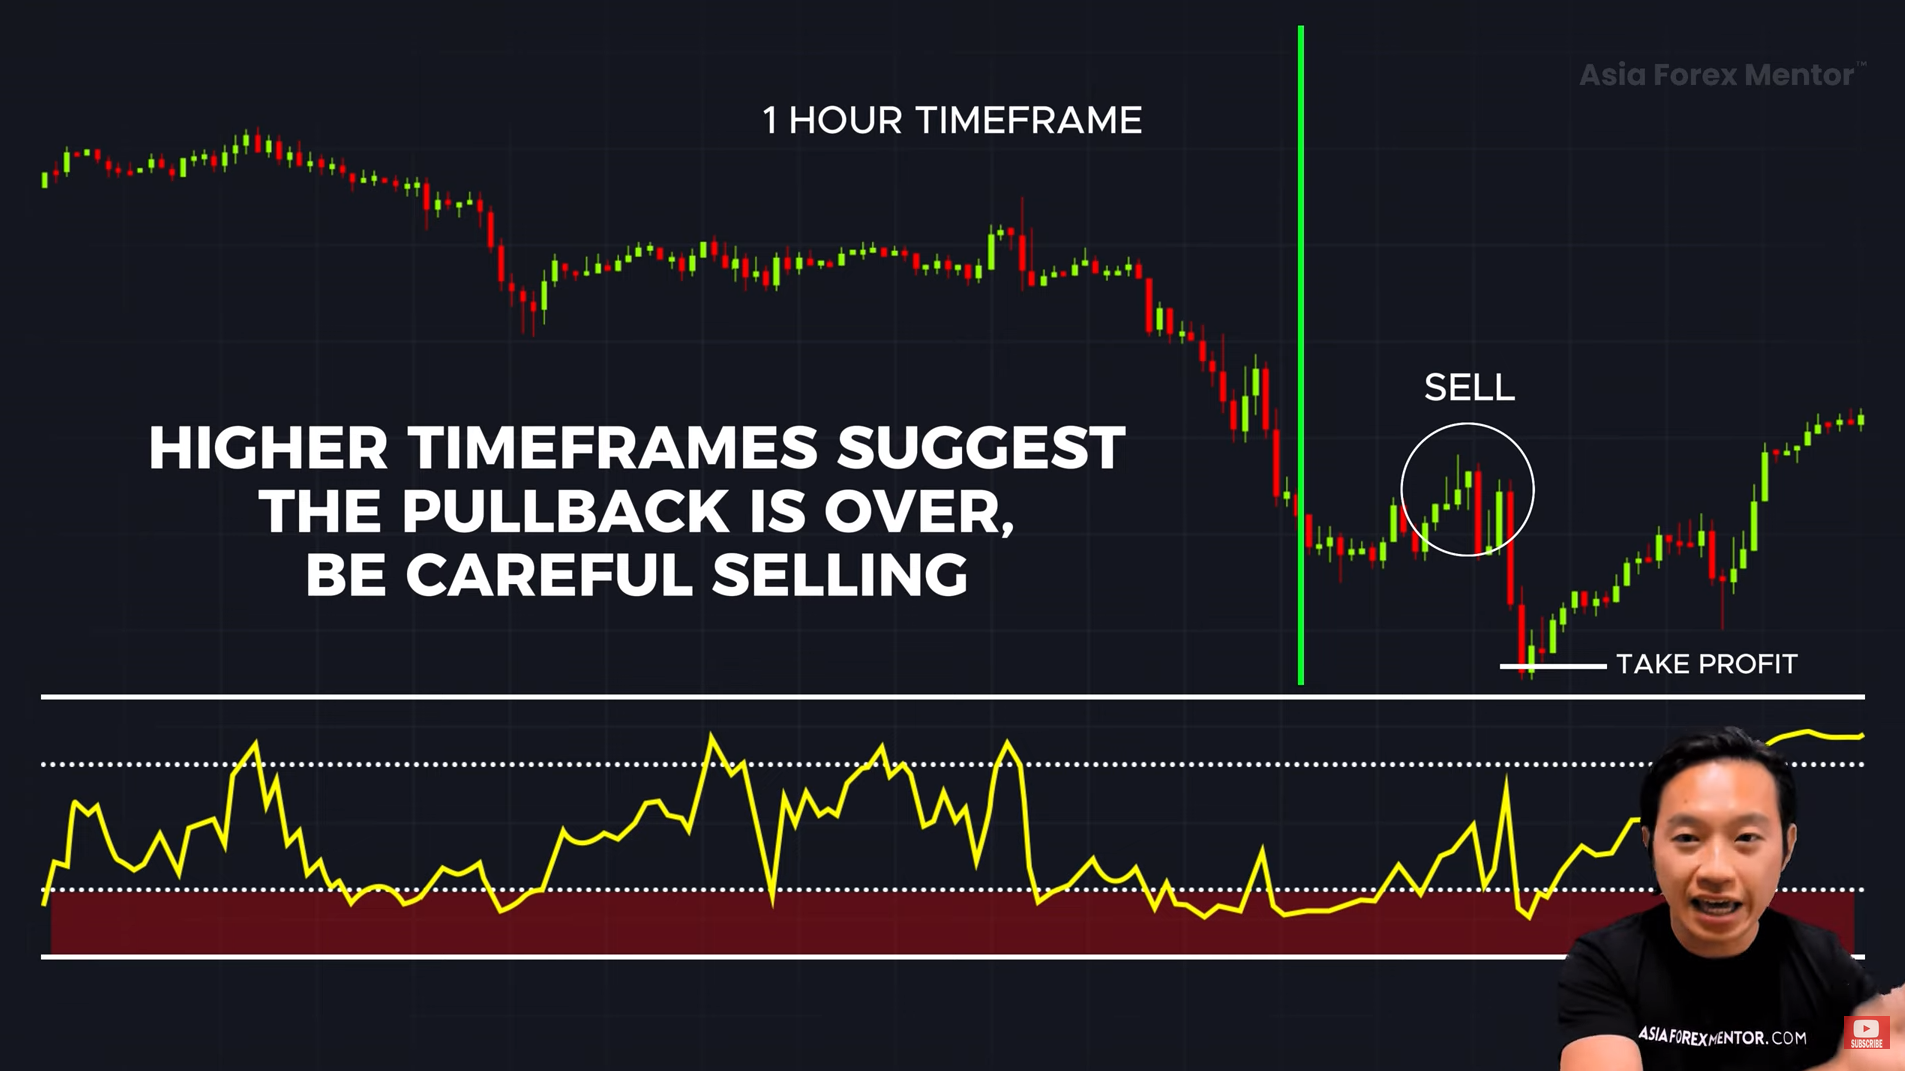
Downtrend Strategy (Selling During a Pullback) 🔴
✔️ Wait for the stochastic to rise above 80 (overbought).
✔️ Once the stochastic drops back below 80, the downtrend may be resuming.
✔️ Enter a short (sell) trade.
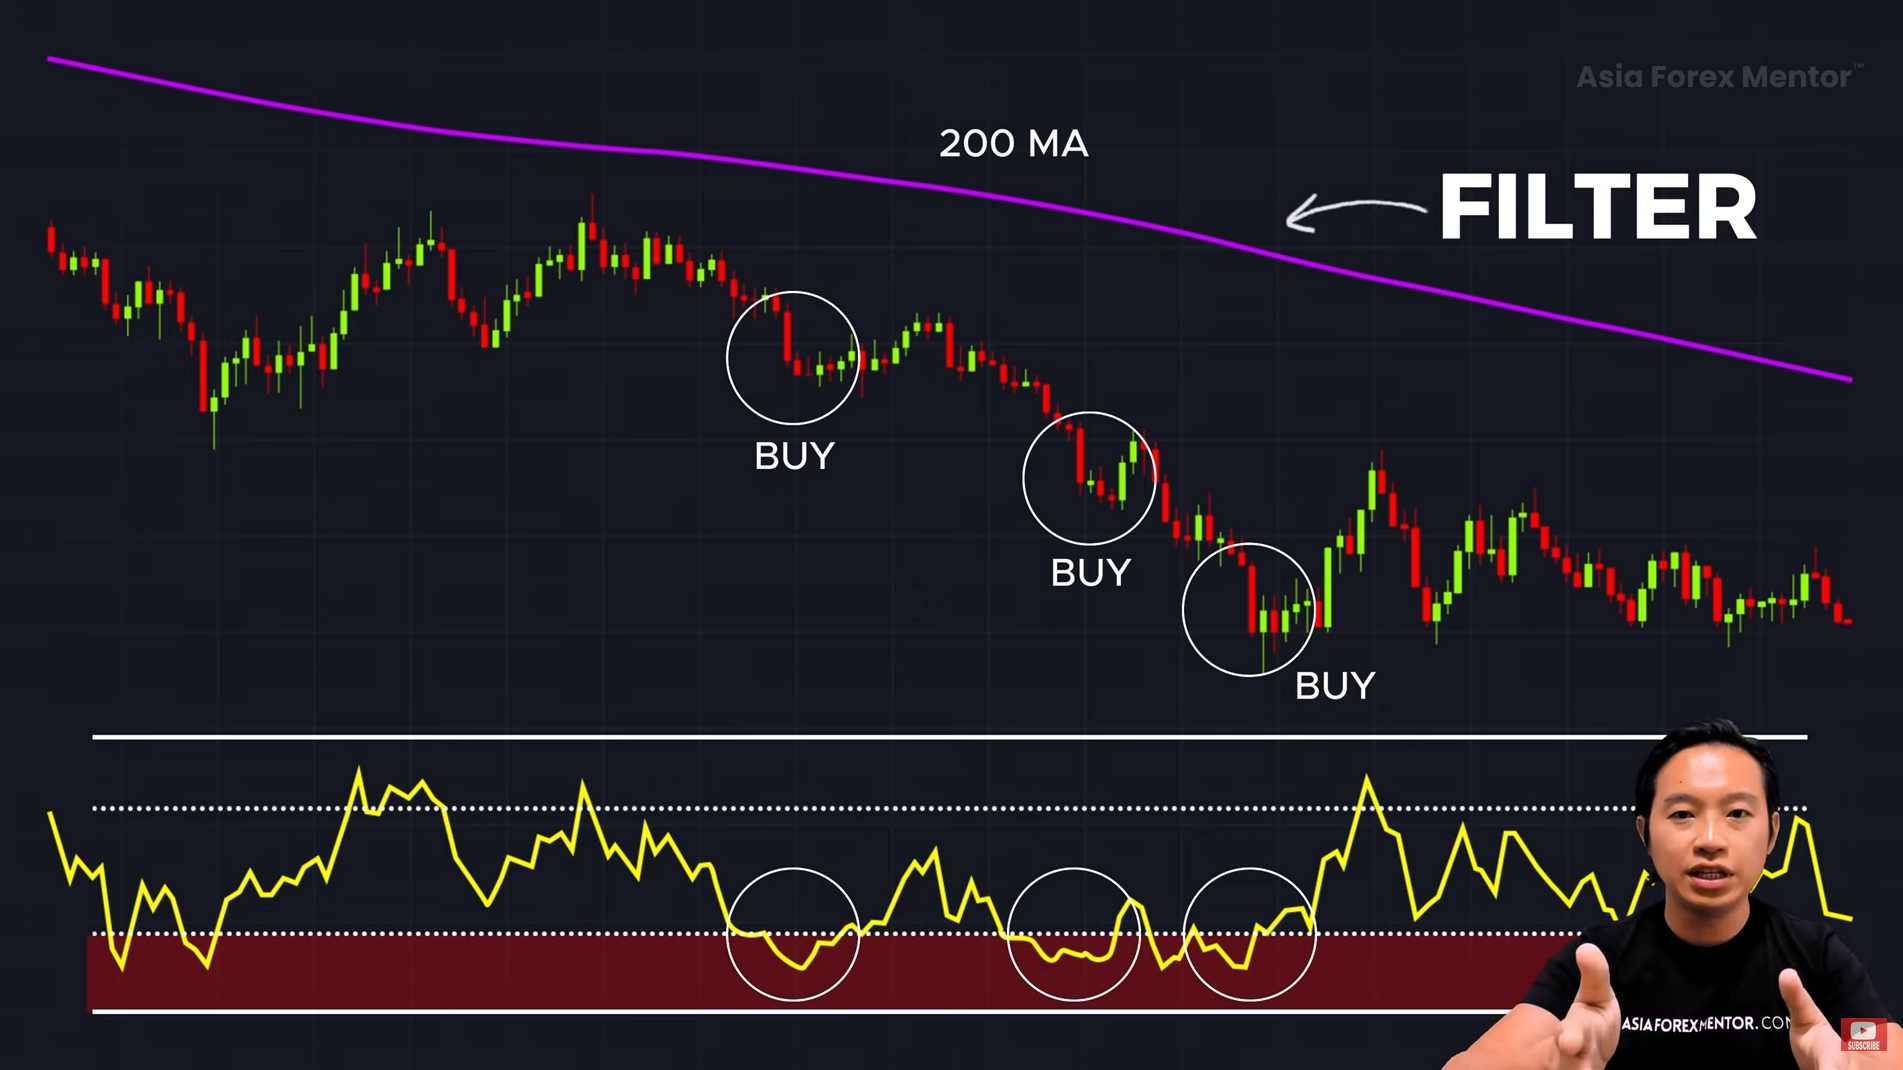
#2. Combine Stochastic with the 200-Moving Average (MA) Trend Filter 📊
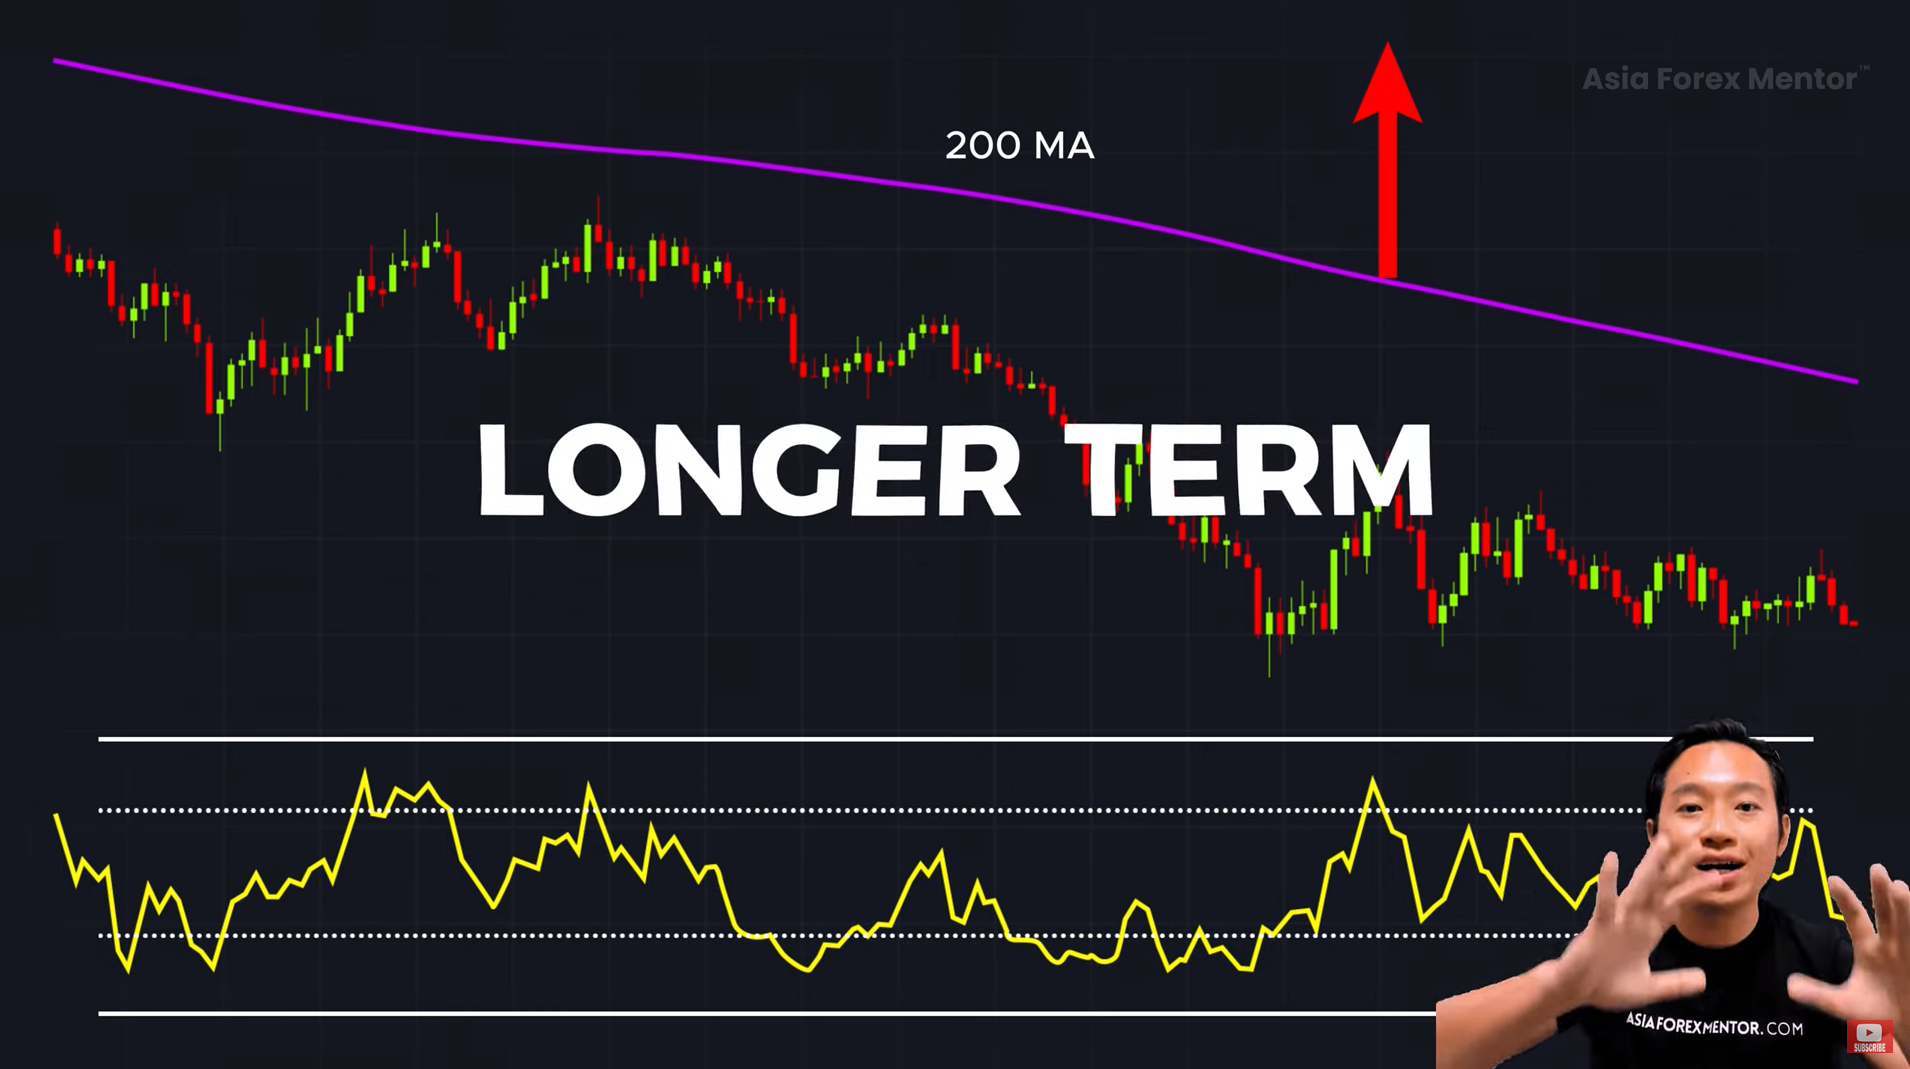
A simple way to filter good trades from bad ones is to use the 200-period Moving Average (MA) to determine the main trend:
- If price is above the 200-MA → Look for buying opportunities (uptrend).
- If price is below the 200-MA → Look for selling opportunities (downtrend).
✅ Why it works: Prevents you from trading against the dominant market trend.
#Advanced Strategy: Multi-Timeframe Stochastic Trading ⏳
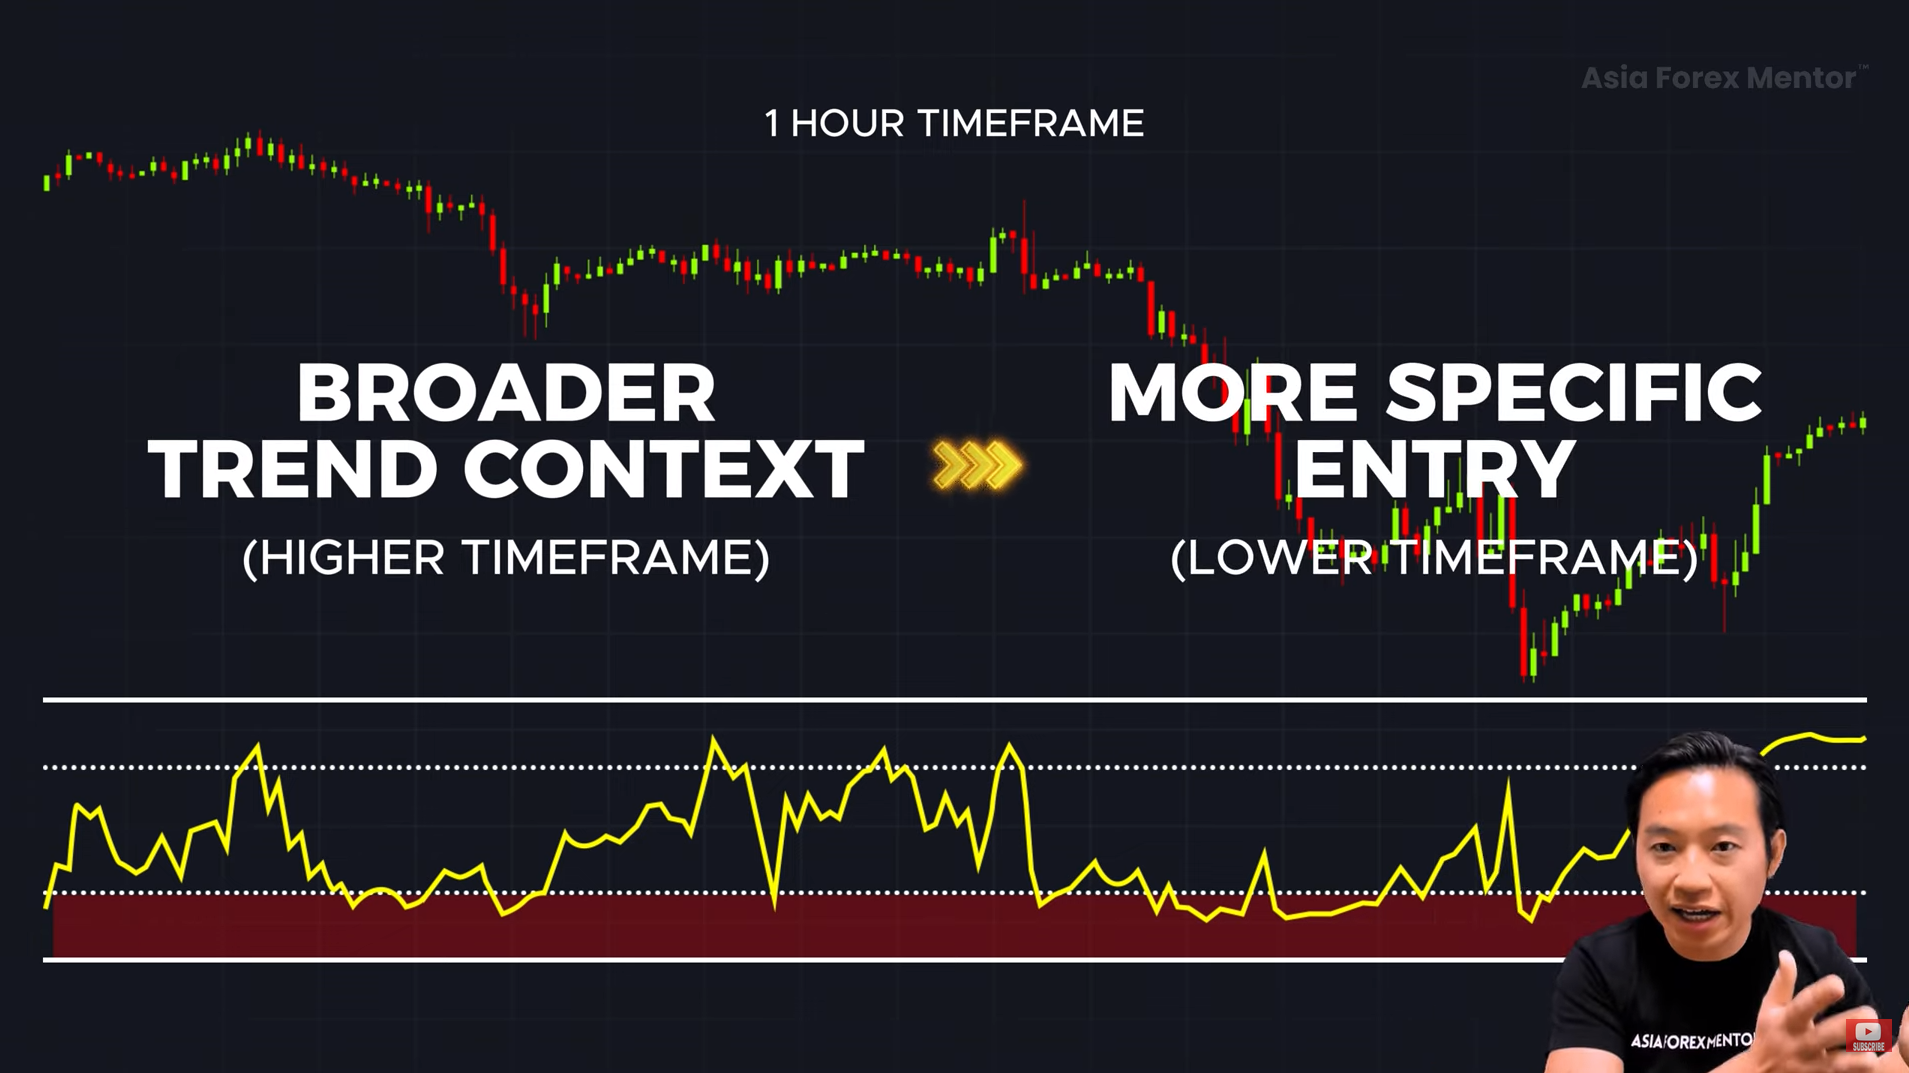
If you want to increase your win rate, here’s a pro strategy: Multi-Timeframe Analysis.
How it Works:
1️⃣ Identify the trend on a higher timeframe (Daily Chart).
2️⃣ Look for Stochastic signals on a lower timeframe (1-Hour Chart).
3️⃣ Wait for confirmation (e.g., candlestick patterns) before entering a trade.
💡 Example:
- The Daily Chart shows a strong uptrend.
- The 1-Hour Chart shows stochastic is in the oversold zone (below 20).
- A bullish candlestick pattern appears → You enter a long trade.
Final Thoughts: Using Stochastic the Right Way 🤔
The Stochastic Indicator is powerful, but only if you use it correctly.
Key Takeaways:
✔️ Don’t blindly trade overbought/oversold signals. Always check the trend.
✔️ Use the 200-MA as a trend filter. Trade with the momentum, not against it.
✔️ Use stochastic to time pullbacks. Enter at the best possible price.
✔️ Try multi-timeframe analysis. Combine different timeframes for better accuracy.
If you apply these strategies, you’ll improve your trade entries and exits, avoid common pitfalls, and trade with the confidence of a pro. 🚀
What’s Next?📢

If you found this guide helpful, check out the other articles and videos and learn more! 💬
Also, check out my free 5-part trading training where I break down real trading strategies in detail—link in the description.
Happy trading! 🎯🚀
Final Notes on Writing Style & Structure
- ✅ Conversational & Engaging Tone
- ✅ Easy-to-Follow Structure with Clear Steps
- ✅ Actionable Tips & Real Trading Examples
- ✅ Timestamps & Emojis for Visual Appeal
FAQs
How to use the stochastic indicator effectively in trading?
The stochastic indicator works best when combined with price trend, support and resistance levels, and other technical analysis tools. It measures price momentum by comparing the current closing price to the asset’s price history. Using the slow stochastic, moving average, or RSI helps filter market noise and reduce false signals.
What is the stochastic divergence strategy, and how does it help in trading?
The stochastic divergence strategy identifies potential trend reversals by comparing price movements and stochastic lines. A bullish divergence occurs when price makes a lower low, but the stochastic oscillator makes a higher low, signaling a bullish entry point. A bearish divergence occurs when price makes a higher high, but the stochastic oscillator forms a lower high, generating sell signals and reversal signals.
Why do overbought and oversold signals sometimes generate false signals?
In strong trends, overbought or oversold signals can be misleading as price can stay in those regions for a long time. To reduce false signals, traders should use the stochastic oscillator settings with trend indicators, the three-period moving average, and RSI to confirm trend reversals.