There are few technical indicators that are respected by technical analysts globally. Most successful investors have few technical indicators in common because they are tried and tested by successful traders.
One such indicator is the Moving Average; the simple technical tool is obviously the most used technical indicator. The moving average indicators do not need complex high-speed computers capable of doing millions of calculations per second. Not only technical analysts but also fundamental analysts also look for the moving average for confirmation of their analysis.
The moving average forex technical indicator is commonly found in all trading platforms and can be calculated manually too. Though the indicator is criticized by forex technical analysts for its lagging nature, its uncanny ability to perform and deliver results overshadows the criticism.
The moving average has been adjusted and improved by many software programmers and technical analysts to incorporate in their forex technical trading strategies. However, it’s true that even the simple moving average finds its way in many automated forex trading strategies.
Contents
- The Moving Average
- How To Trade Using 50 Day Moving Average
- Trading Using Multiple Moving Averages
- Golden cross
- Death cross
- Trading Pullbacks With 50 Day Moving Average Price
- Additional Confirmation And Trading With Confluence
- Limitations
- Conclusion
The Moving Average

Moving averages can be calculated with different parameters and plotted automatically in the price charts. The indicator can be calculated using the price of the four major price points of a candlestick or bar chart. The average price of Open, High, Low, and Close values are the prominent values used in moving average calculation however the commonly used value is the closing price.
In such a case, the average of the closing price for “n” periods is plotted continuously in the price chart. However, additional values like Median price, Typical price, and Weighted close price can be derived from the Open, High, Low, and Close values and used for moving averages calculation.
The method of calculation also differs and is suitable for various trading strategies and according to the requirement of the forex and stock market trader to support the technical analysis. The various methods are Simple Moving average, Exponential Moving average, Smoothed Moving average, and Linear Weighted Moving averages. The exponential moving average adds more weight to the latest market movements.
The 50 day moving average is one of the most preferred moving averages. Technical analysts and forex investors are mostly following price trends and trade based on the identified trends. The trend-following begins with an analysis of the 50 day moving average. This moving average value is accepted by long-term forex technical traders as the best reference point to understand both the Bullish and Bearish price trends. Long-term traders mostly BUY or SELL based on the price trend and continue to stay bullish or bearish based on the 50 day moving average.
How To Trade Using 50 Day Moving Average

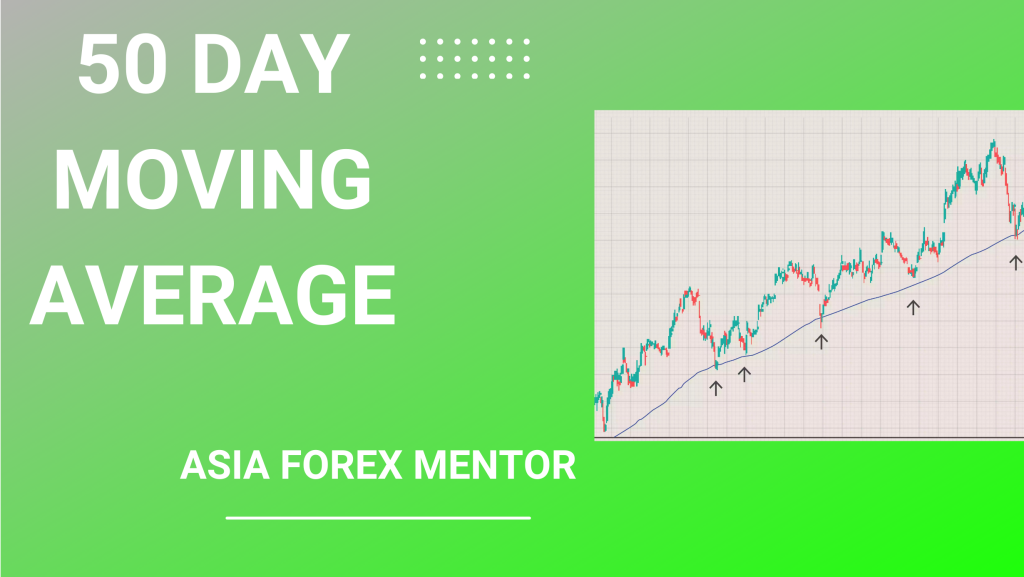
The importance of identifying the market trend is paramount in technical analysis. The 50 Day Moving average does the same and identifies the current market trend. Once the trend is identified forex investors can follow the trend and ride the trend until it’s over. The profitable technical strategy of trend following is shown in the above price chart by using the 50 day moving average indicator.
Once the price crosses the 50 day moving average from downside to upside, the market is considered to move to a bullish trend. So, forex traders can place a BUY trade with a stop loss below the previous swing low. As long as the price stays above the 50 day moving average, it is considered bullish so traders can continue to hold the BUY positions and ride the trend.
If the price fall below the 50 day moving average and closes below the moving average the uptrend is considered and complete. So, forex traders can exit the trade once the price crosses the moving average line, as the price crosses from above the moving average and moves down it signals the opposite signal. Similarly on a bearish price trend forex traders can enter a SELL trade and continue to hold the position until the price stays below the moving average and exit on the opposite signal with a profit.
Also Read: How Does Money Flow Index Work?
Trading Using Multiple Moving Averages

There are various methods to trade the moving averages, one such method is by combining multiple moving averages. The best performing moving averages other than the 50 Day is the 100 Day and 200 Day moving averages. These moving averages can be combined to form BUY and SELL trading strategies. The above price chart shows the 50, 100, and 200 day moving averages plotted in the same financial markets price chart. As shown the moving averages with higher values produce smoother lines and also display a longer trend and allows the trader to stay in the trend for a longer period of time.
The three moving averages can be traded independently or in combination with others. The choice of the moving average period depends upon the trading requirement of the trader and the trading strategy.
Golden cross

As discussed earlier the above trading strategy combines the 50 and 200 day moving averages. The previous trading strategy took into account the 50 Day moving average alone. However, this trading strategy called the Golden Cross uses both 50 and 200 Moving averages.
If the 50 Day moving average crosses the 200 days moving average to the upside it is considered a strong bullish signal. So, traders can place a BUY order as this bullish crossover is watched by most traders and is considered as a long-term trading signal. The traders can continue to hold the position as long as the 50 Moving average stays above the 200 Day Moving average.
The cross over of the 50 Day moving average above the 200 day moving average is called the Golden cross since the cross over results in long-term trends and produces profitable trading results most of the time. As a result, it is a low-risk forex trading strategy with a good risk and reward ratio. Generally, the risk and reward ratio is too good that technical traders follow the charts to enter this opportunity.
Death cross

The Death cross forex technical trading strategy is similar to the Golden Cross but is a bearish crossover. In the Death cross the 50 Day moving average crosses over the 200 day MA in a down cross. The sell signal of the crossover is equally significant and rewarding as the Golden cross. Traders can enter a SELL trade once the Death cross is completed with a stop loss above the previous swing high. The price movement above the previous swing high may negate the down cross and indicates the presence of Buyers in the market.
On the other hand, forex traders can hold the positions and keep their take-profit positions open and ride the trend. Traders can keep the positions open as long as the 50 MA is below the 200 MA.
Trading Pullbacks With 50 Day Moving Average Price

Moving averages act as support and resistance, as the moving average lines are continuously plotted, they act as moving support and resistance. Hence, traders can use the moving averages to apply another method of trading called the pullbacks. Pullbacks have an element of risk associated with them, but are very rewarding and provide a very low-risk trading opportunity.
In an up cross, the price generally tends to complete the cross over and then retraces back towards the moving average before finding support and then rising again. In fact, pullbacks provide the best possible entry price the stop loss is generally very tight as the breakdown of support may invalidate the uptrend. On the other, hand a successful bounce from the moving average line will produce a rewarding trade.
Additional Confirmation And Trading With Confluence
The moving average like any other technical indicators produces false trading signals. So, application of other forex technical indicators for additional confirmation is essential to achieve the best trading results.
Trades can use price action as the primary tool to identify the market intend and look at price action for confirmation candlestick patterns and chart patterns are used by many traders for confirmation.
Technical tools like support and resistance and channels and other patterns help the trader to confirm the change of trend direction. Another important indication is the trading volume, trend changes are normally associated with heightened trading volumes. The occurrence of high volumes during the price cross over the of 50 Day Moving average helps the trader to confirm the trend changes.
Additional technical indicators and momentum indicators can be used to confirm the trend changes in confluence with 50 Day Moving Averages.
Limitations
Moving average is a lagging indicator, which means that the trading signals produced by the indicator are lagging as they are based on the past price movement and do not predict the future price movement. However, the indicator has a reputation of providing highly rewarding trades while producing trades with small losses.
The best method to use the indicator is to use other technical tools and indicators in confluence with the 50 day moving average and also use support, resistance, channels and chart patterns, and candlestick patterns, and price action.
Conclusion
The moving average is the best trend following indicators widely accepted and used by many successful traders. The 50 Day moving average is considered as a gauge to identify the trend direction. The indicator can be combined with other moving averages to form more complex trading strategies.
The 50 day moving average can be constructed with multiple price points, however, the simple moving average calculated using the closing prices provides great forex trading results. There are many automated forex trading softwares that sue moving averages to calculate the price trend before applying other calculations. Forex traders can trade the moving average as a stand-alone indicator as it provides entry and exit points. It can be easily traded by new and advanced forex traders.
Also Read: Top 9 Stock Scanners


